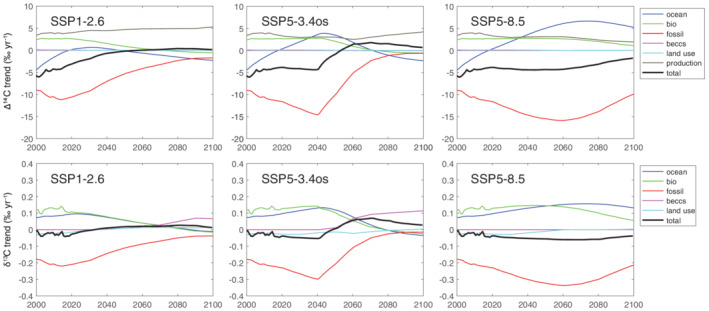
Figure 7.

Simulated trend components for Δ14CO2 (top row) and δ13CO2 (bottom row) for SSP1‐2.6, SSP5‐3.4os, and SSP5‐8.5. Other SSP‐based scenarios are shown in Figure S1. Colored lines show the midrange values across the 32 sets of parameters used in the simulations. BECCS and land use contributions are uniformly near zero for Δ14CO2.
