FIGURE 5.

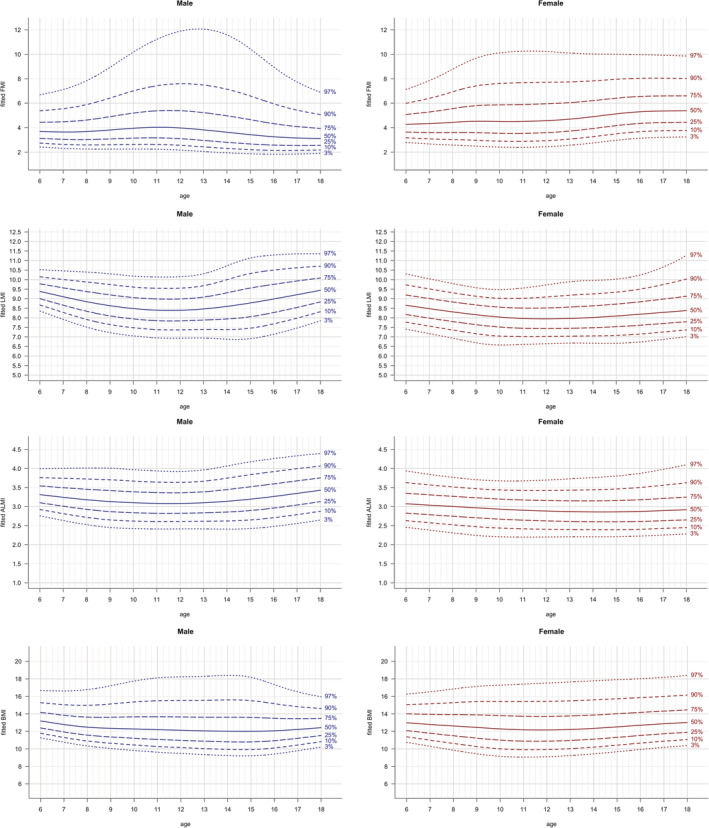
Fitted body composition parameters: fFMI, fLMI, fALMI, fBMI vs age. Lines indicate 3rd, 10th, 25th, 50th, 75th, 90th and 97th percentile. Age in years, fFMI in kg/m2.5, fLMI in kg/m3, fALMI in kg/m3.5 and fBMI in kg/m3

Fitted body composition parameters: fFMI, fLMI, fALMI, fBMI vs age. Lines indicate 3rd, 10th, 25th, 50th, 75th, 90th and 97th percentile. Age in years, fFMI in kg/m2.5, fLMI in kg/m3, fALMI in kg/m3.5 and fBMI in kg/m3