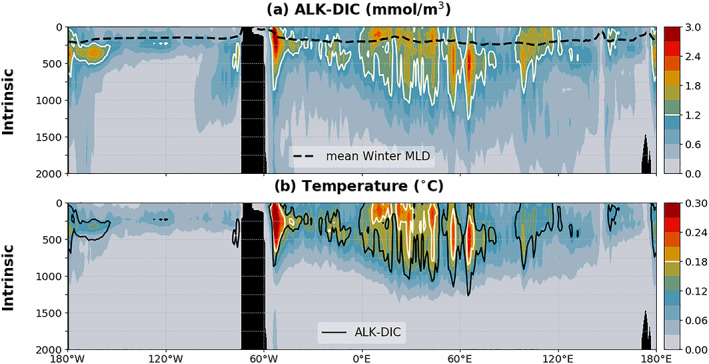
Figure 3.

Vertical sections of interannual CIV averaged over 35–45°S, for (a) ALK‐DIC and (b) temperature. The black dashed line in (a) highlights the mean winter MLD. The black solid line in (b) corresponds to the 1.2‐mmol/m3 ALK‐DIC contour superimposed in pale yellow on (a).
