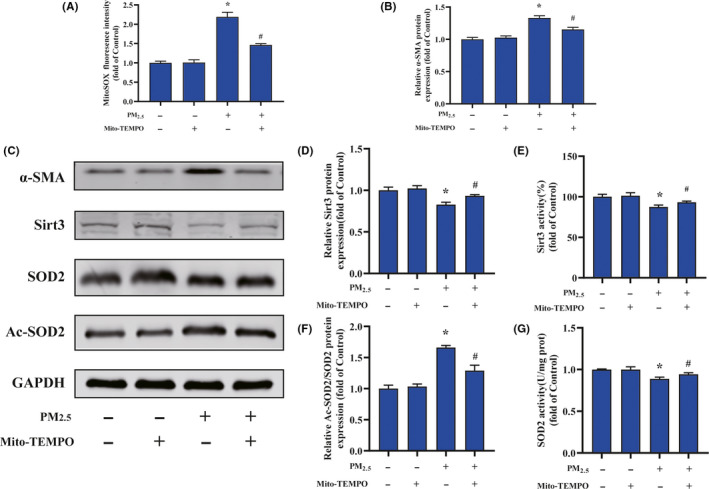
FIGURE 5.

Mitochondrial‐derived ROS mediated PM2.5‐induced cardiac myofibroblast conversion. A, Quantification analysis of fluorescence intensity obtained from flow cytometry. B, The quantitative analysis of α‐SMA protein levels. C, Representative Western blot pictures. D, The quantitative analysis of SIRT3 protein levels. E, The activity of SIRT3. F, The quantitative analysis of SOD2 acetylation. G, The activity of SOD2. Data are expressed as the means ± SD from three independent experiments. *P < .05 compared to control group;# P < .05 compared to PM2.5‐treated group
