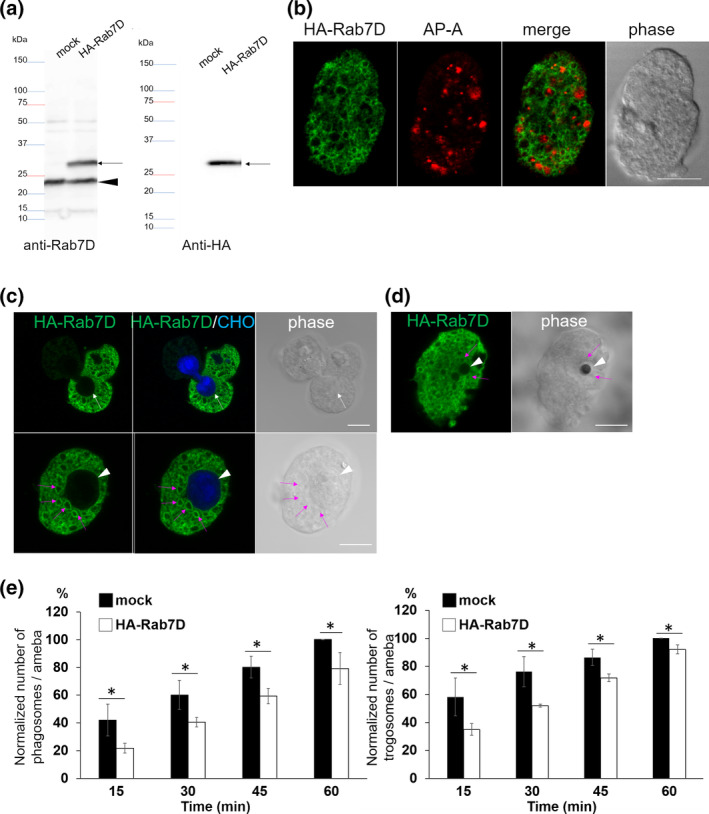
FIGURE 1.

Expression and localization of HA‐EhRab7D and the effect of EhRab7D overexpression on phagocytosis and trogocytosis. (a) Immunoblot analysis of HA‐EhRab7D in E. histolytica transformants. Total cell lysates from mock‐transfected control (mock) and HA‐EhRab7D‐expressing transformant (HA‐Rab7D) were subjected to SDS‐PAGE and immunoblot analysis using the anti‐EhRab7D (left panel) and anti‐HA (right panel) antibodies. Arrows indicate HA‐EhRab7D. An arrowhead indicates intrinsic wild‐type EhRab7D. (b) Localization of HA‐EhRab7D in quiescent state. HA‐EhRab7D‐expressing transformant was fixed and reacted with anti‐HA (green) and anti‐AP‐A (red) antibodies. Bar, 10 μm. (c) Localization of HA‐EhRab7D during trogocytosis. HA‐EhRab7D expressing E. histolytica trophozoites were co‐cultured with CellTracker Blue‐stained live CHO cells for 15 min, fixed, and reacted with the anti‐HA antibody (green). A white arrow indicate trogocytic cup. An arrowhead indicate the trogosome. Magenta arrows indicate HA‐EhRab7D‐associated vesicles adjacent to the trogosome. Bar, 10 μm. (d) Localization of HA‐EhRab7D during phagocytosis of artificial beads. HA‐EhRab7D expressing E. histolytica trophozoites were incubated with human serum coated Dynabeads (2.8‐μm diameter) for 15 min, fixed, and reacted with the anti‐HA antibody (green). A white arrowhead and magenta arrows indicate the phagosome and HA‐EhRab7D‐associated vesicles, respectively. Bar, 10 μm. (e) The effect of HA‐ERab7D expression on phagocytosis and trogocytosis. Trophozoites of mock transfected and HA‐EhRab7D expressing strains were prestained with CellTracker Blue and co‐cultivated with live or heat‐killed CHO cells that had been prestained with CellTracker Orange to evaluate trogocytosis or phagocytosis, respectively. Microscopic images were captured on CQ1 every 15 min for 60 min and analysed to calculate the average numbers of CHO cell‐containing trogo‐/phagosomes per ameba. All data were normalised against the values obtained for control at 1 hr and are shown as percentages to these values. Data of one representative experiment was shown. Statistical significance was examined with Student's t test, *p < .05. n = 3
