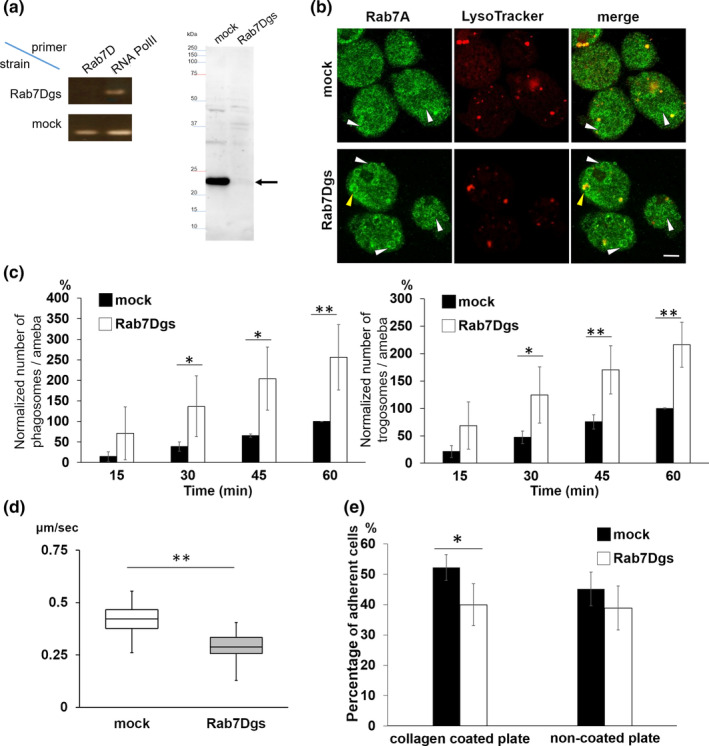
FIGURE 3.

Establishment and phenotypes of EhRab7D gene silenced strain. (a) Confirmation of gene silencing by reverse transcriptase (RT)‐PCR (left panel) and immunoblot (right panel) analysis of mock transfected and EhRab7D gene silenced (gs) strain. Transcripts of EhRab7D and RNA polymerase II genes were amplified by RT‐PCR from cDNA isolated from the transformants and examined by agarose gel electrophoresis (left panel). Total lysate of the transformants were subjected to SDS‐PAGE and immunoblot analysis using the anti‐EhRab7D antibody (right panel). (b) Localization of EhRab7A and LysoTracker in EhRab7D gs and control strains. EhRab7D gs and mock transfected strains were stained with LysoTracker Red, fixed, and reacted with anti‐EhRab7A antibody (green). The diameter of the largest EhRab7A‐positive vacuole in each cell was measured in 50 trophozoites from three independent experiments. (c) The effect of gene silencing of EhRab7D gene on phagocytosis (left) and trogocytosis (right). Trophozoites of mock transfected and EhRab7D gene silenced strains prestained with CellTracker Blue were co‐cultivated with heat‐killed (left panel) or live (right panel) CHO cells prestained with CellTracker Orange to evaluate phagocytosis or trogocytosis, respectively. Also see the legend in Figure 1e. Statistical significance was examined with t‐test, *p < .05, **p < .01. n = 4. (d) Cell motility of mock transfected and EhRab7D gene silenced strain. The trophozoites of the indicated strains were stained with CellTracker Green were incubated with BI medium at 35.5°C on a collagen‐coated glass‐bottom dish. Time‐lapse images were collected every 30 s for 15 min on LSM780 and processed using Imaris software. Data form one representative experiment was shown. Statistical significance was examined with Dunnet test, **p < .05. n = 2. (e) Adhesion to collagen coated and non‐coated plastic plates of mock transfected and EhRab7D gene silenced strain. Trophozoites were prestained with CellTracker Green and incubated with BI medium on indicated plates at 35.5°C for 40 min. After incubation, the plates were gently rinsed with fresh warm BI medium, and the fluorescence intensity of each well before and after washing was measured, normalised against the value of the mock control at 60 min, and is shown in percentage. Statistical significance was examined with t‐test, *p < .05 and n = 4
