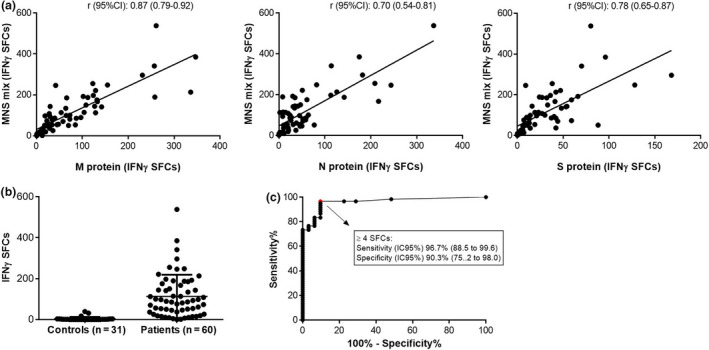
Figure 2.

Characteristics of IFNγ T‐CoV‐Spot assay using the MNS mix as antigenic preparation. (a) Correlation (Spearman’s rank correlation) between IFNγ‐SFC counts with MNS and with M, N and S alone in the first 60 patients. (b) IFNγ‐SFC counts with MNS in 31 controls and 60 SARS‐CoV‐2 patients. (c) ROC curve for T‐CoV‐Spot using the MNS mix with an optimal cut‐off value at 4 IFNγ‐SFCs.
