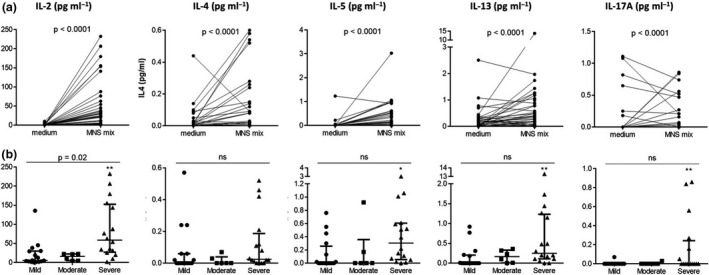
Figure 4.

Cytokine levels in the supernatants of PBMCs from SARS‐CoV‐2 patients. (a) Cytokine levels detected after stimulation by the MNS mix or in the negative control (medium). P‐values are from the Wilcoxon test. (b) Cytokine levels detected after stimulation by the MNS mix, according to the severity of the disease in mild (n = 16), moderate (n = 6) and severe patients (n = 16). P‐values are calculated using partial Spearman’s rank correlation coefficients with severity status, adjusted for time from symptom onset to sampling. Comparisons between severe and mild patients using Dunn’s tests (post hoc for the Kruskal–Wallis test) are indicated as *P ≤ 0.05 or **P ≤ 0.01.
