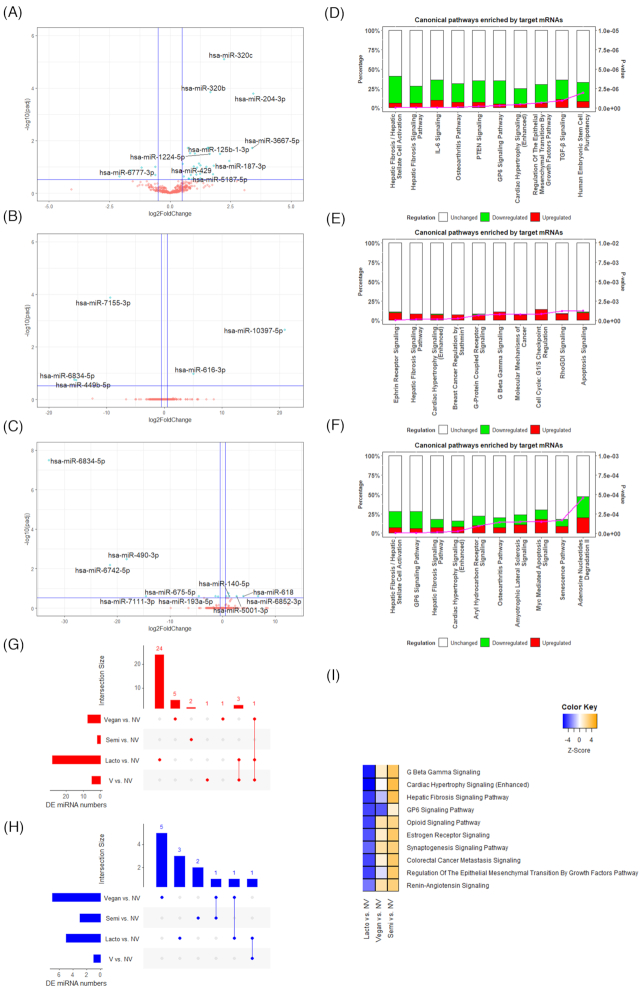
Figure 3.
Differentially expressed miRNAs in lacto, semi, and vegan vegetarians compared to NV. Volcano plots showing the differentially expressed miRNAs between (A) Lacto and NV; (B) Semi and NV; and (C) Vegan and NV. –log10(padj) ≥ 0.52 (padj ≤ 0.3) and |log2FC| ≥ 0.5 were marked as the significant threshold. The significant DE miRNAs (top 10 DE miRNA by |log2FC| if more than 10 significant DE miRNAs present) are highlighted. Bar graphs showing the top 10 enriched canonical pathways between (D) Lacto and NV; (E) Semi and NV; (F) Vegan and NV. UpSet plots showing the number of significantly (G) upregulated; and (H) downregulated DE miRNAs across four comparisons (Lacto vs. NV, Semi vs. NV, Vegan vs. NV and V vs. NV in general), and the overlapping between each set of miRNAs. (I) Most distinctive enrichments in canonical pathway among three vegetarian subgroups. V: vegetarians, NV: non-vegetarians, Lacto: lacto-ovo-vegetarians; Semi: semi-vegetarians.

