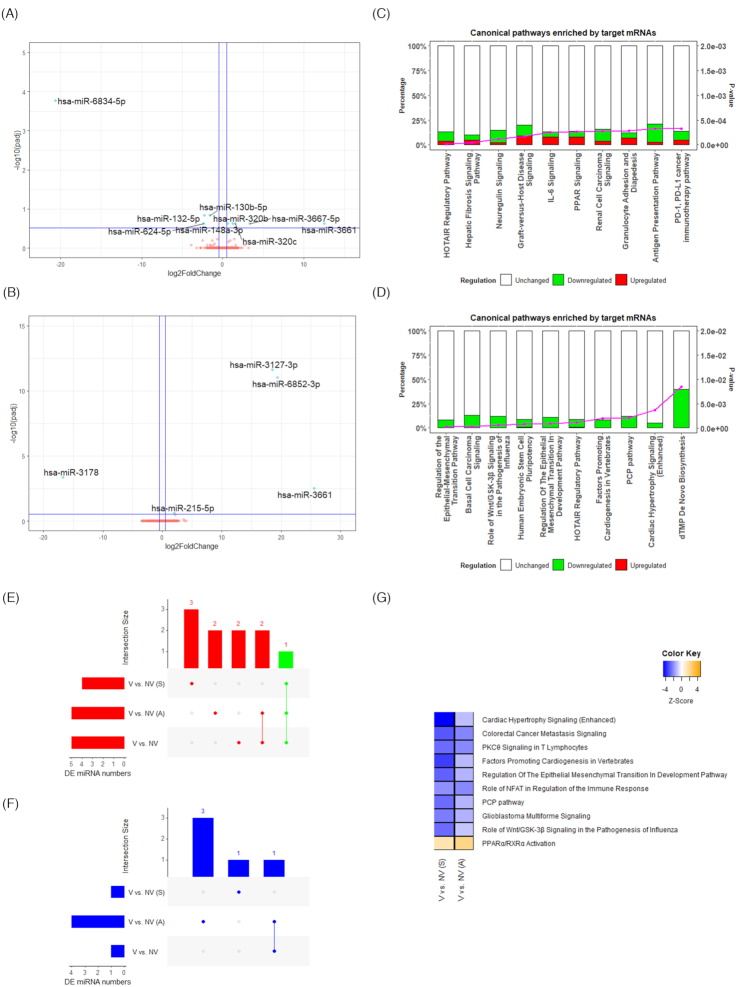
Figure 5.
Differentially expressed miRNAs in adherers and switchers. Volcano plot showing differentially expressed miRNAs between V and NV in (A) adherers and (B) switchers. –log10(padj) ≥ 0.52 (padj ≤ 0.3) and |log2FC| ≥ 0.5 were marked as the significant threshold. The significant DE miRNAs (top 10 DE miRNA by |log2FC| if more than 10 significant DE miRNAs present) are highlighted. Bar graphs showing the top 10 enriched canonical pathways between V and NV in (C) adherers and (D) switchers. UpSet plots showing the number of significantly (E) upregulated, and (F) downregulated DE miRNAs across three comparisons (V vs. NV in adherers, V vs. NV in switchers, and V vs. NV in general), and overlapping between each set of miRNAs. The DE miRNAs shared across all three comparisons are highlighted in green. (G) Most distinctive enrichments in canonical pathway between adherer and switcher vegetarians. V: vegetarians, NV: non-vegetarians, A: adherers, S: switchers.

