FIG. 3.

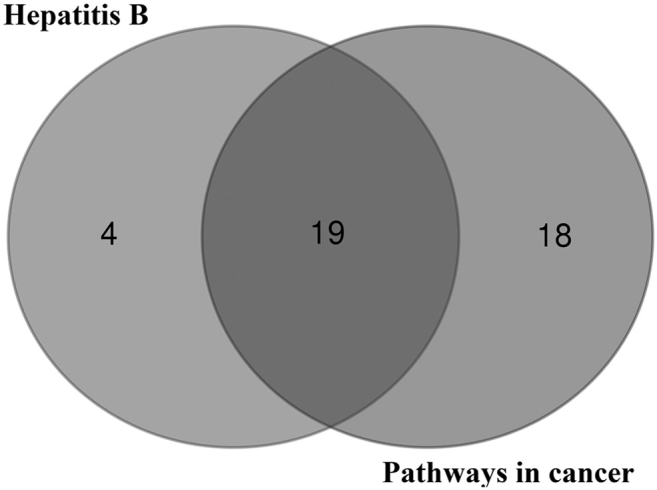
The data of Venn diagram are extracted from hepatitis B and pathways in cancer, and it demonstrate the total number of genes overlapping in the two pathways.

The data of Venn diagram are extracted from hepatitis B and pathways in cancer, and it demonstrate the total number of genes overlapping in the two pathways.