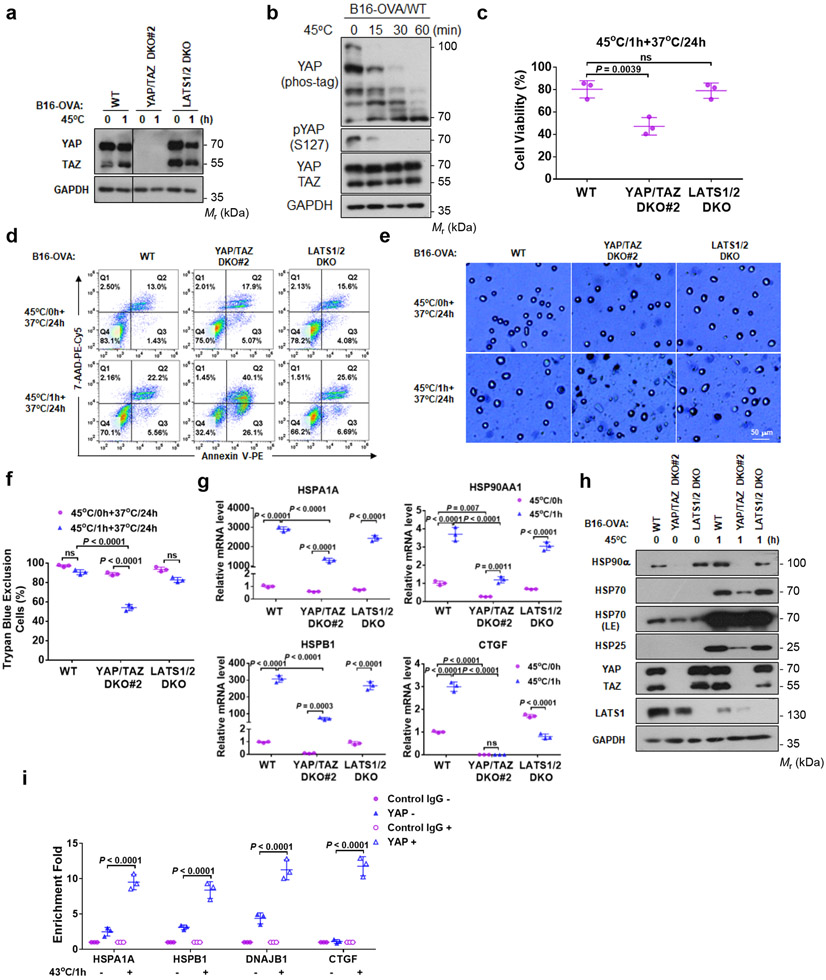
Figure 6. YAP/TAZ have a protective role in heat shock response.
(a) YAP/TAZ knockout in mouse B16-OVA melanoma cells.
(b) 45°C heat shock induces YAP dephosphorylation in B16-OVA cells. Cells under high density were treated at 45°C for the indicated times.
(c) YAP/TAZ deletion increases B16-OVA sensitivity to heat shock. B16-OVA WT, YAP/TAZ DKO#2, and LATS1/2 DKO cells were subjected to heat shock at 45°C for 1 h and placed back at 37°C. 24 h later, cell viability was determined by CCK8 assays. Data are mean ± s.d.; n = 3 biologically independent samples. One-way ANOVA test, ns, not significant.
(d) YAP/TAZ deletion enhances heat shock-induced cell death. Flow cytometry of cells stained with PE-Annexin V and 7-AAD. Representative results from two independent experiments are shown.
(e) YAP/TAZ deletion reduces cell viability upon heat shock. Experiments were similar to panel (c). Cells were stained with trypan blue for dead cells. Representative pictures from three independent samples are shown, scale bar, 50 μm.
(f) Quantification of results from panel e. DATA are mean ± s.d.; n = 3 biologically independent samples. Two-way ANOVA test, ns, not significant.
(g) YAP/TAZ are required for proper HSP gene induction by heat shock. B16-OVA WT, YAP/TAZ DKO#2, and LATS1/2 DKO cells were treated with heat shock at 45°C for 1 h and then recovered at 37°C for 6 h. HSP gene expressions were determined by RT-PCR. Data are mean ± s.d.; n = 3 biologically independent samples. Two-way ANOVA test, ns, not significant.
(h) YAP/TAZ knockout impairs HSP protein induction by heat shock. B16-OVA cells were used in the experiment.
(i) Heat shock increases YAP binding to promoters of HSPs and CTGF. HCT116 cells under high density were treated with heat shock at 43°C for 0 h or 1h, followed by ChIP with control IgG or YAP antibody. The precipitated DNA was quantified by PCR with primers specific to promoter regions of the indicated genes. CTGF was included as a positive control. Data are mean ± s.d.; n = 3 biologically independent samples. Two-way ANOVA test. Immunoblotting in panels a, b and h has been performed two times with similar results. Source data are available online.

