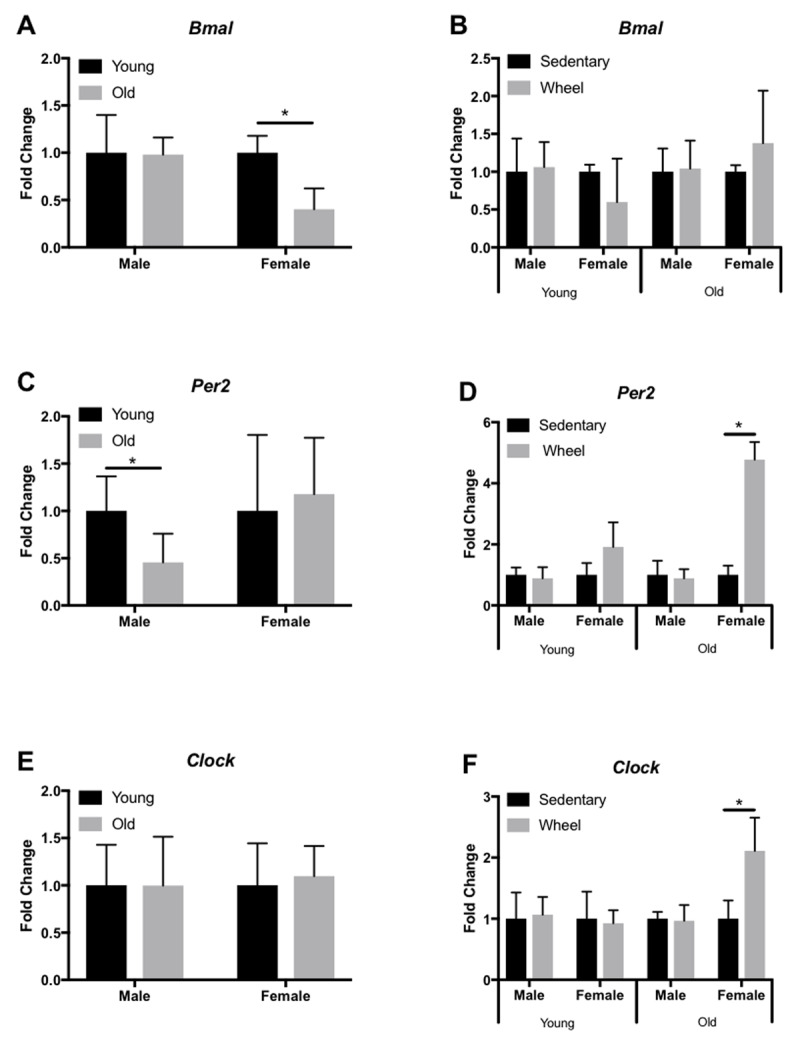
Figure 4.

Circadian expression of clock-controlled genes in the mouse LV. Gene expression was quantified by qRT-PCR and normalized to β-Actin. Samples were collected at 7am. Data are represented as the effect of age (A,C,E) and the effect of wheel running (B,D,F). Data were assessed by Student’s t-test. Data are expressed as means ± SEM. * p < 0.05. (n = 3–4).
