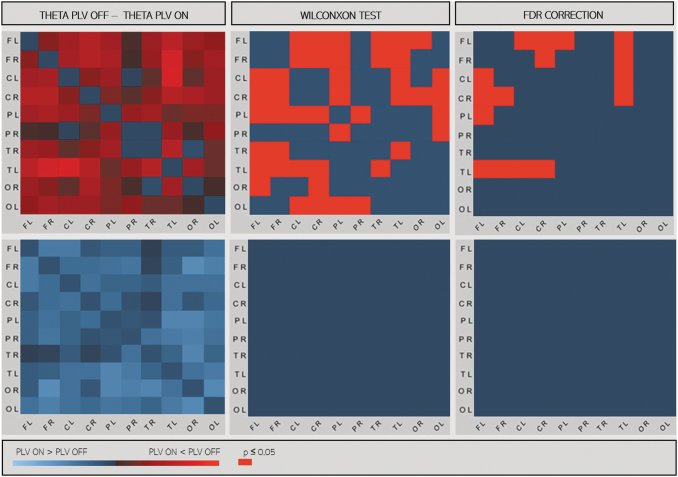
FIG. 4.
PLV matrices in source space between 10 regions in responders (at the top) and nonresponders (at the bottom) in the theta band. In left panels: differences between PLV matrices during ON and OFF epochs (PLV ON − PLV OFF). In right panel, significant differences with the Wilcoxon test and after correction by the FDR are represented in red (p < 0.05). C, central; F, frontal; L, left; O, occipital; P, parietal; PLV, phase-locking value; R, right; T, temporal.

