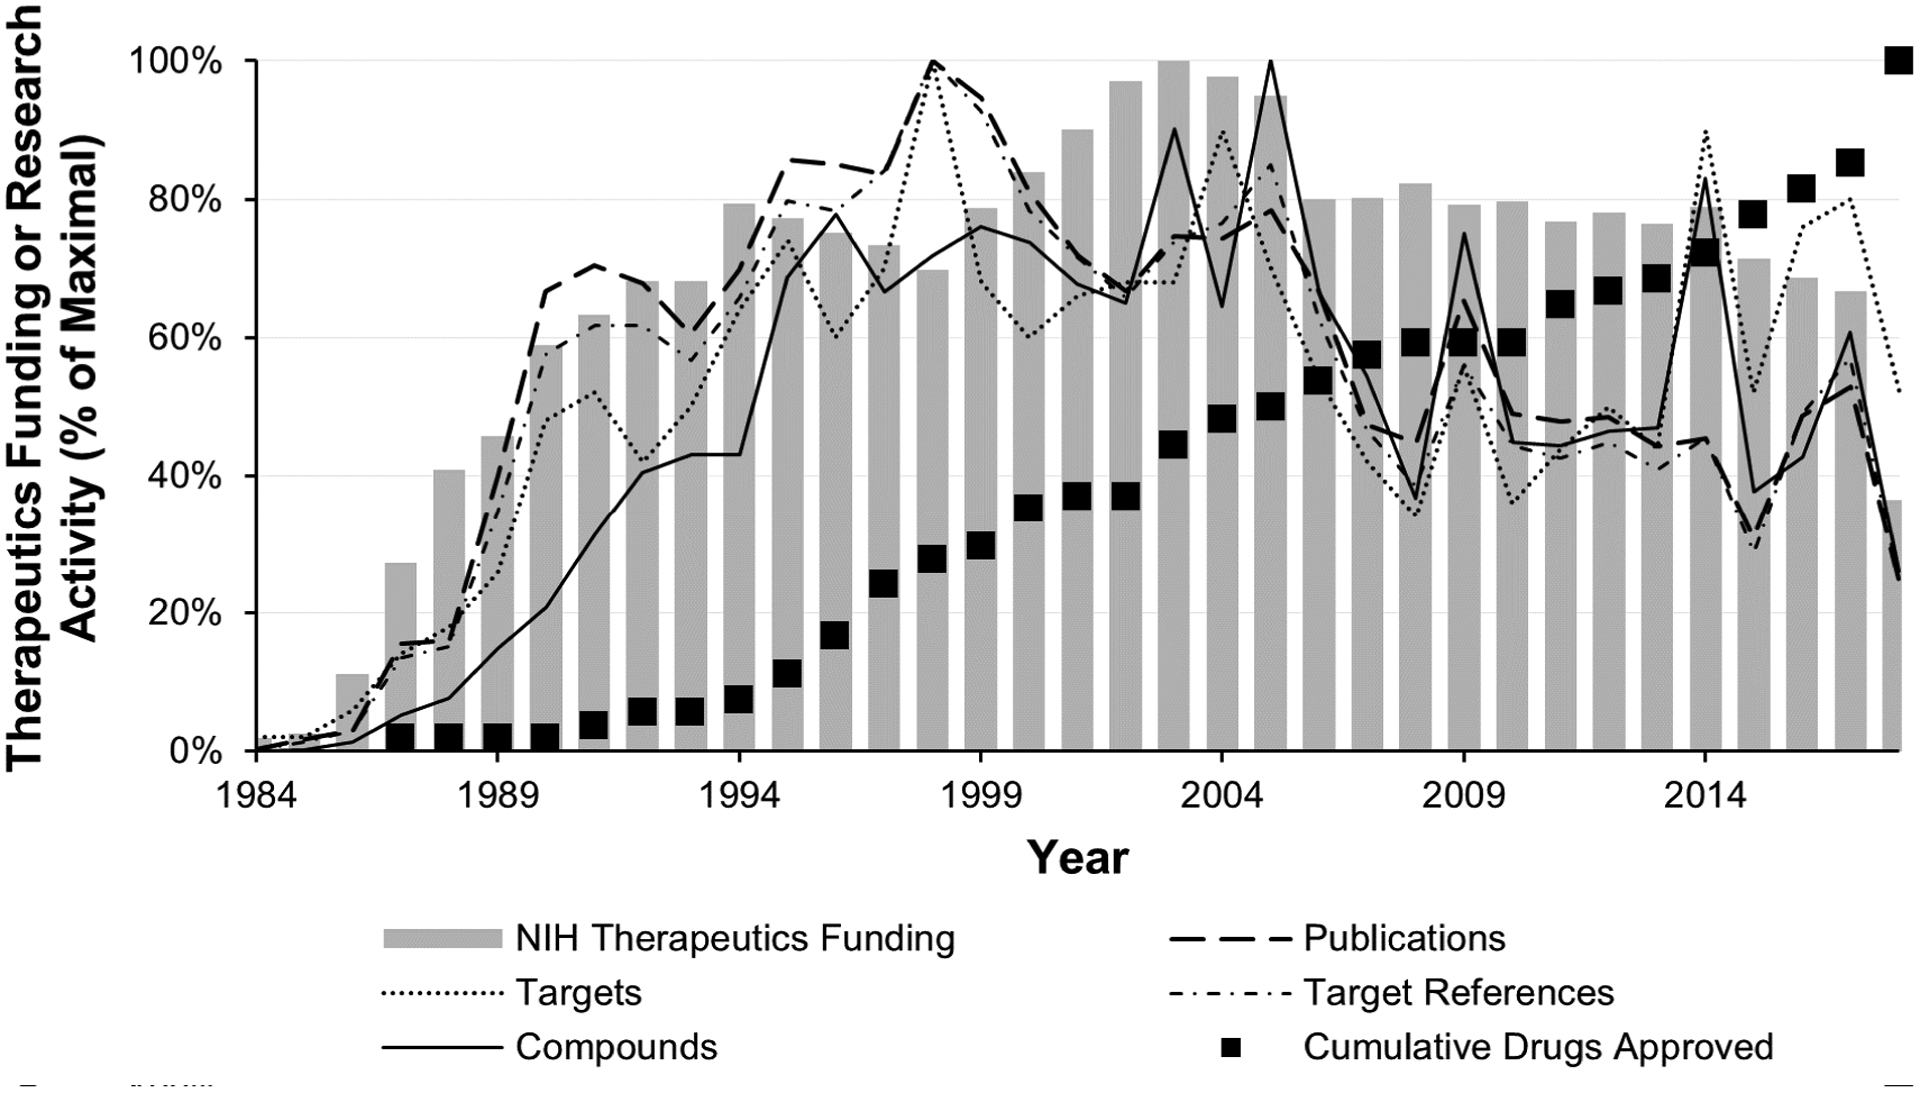
Figure 2.

Comparison of Chem-DB-based metrics for research activities with yearly NIH HIV/AIDS therapeutics funding and FDA drug approvals.
Note: The gray bars indicate the percentage of maximum NIH therapeutics funding per year in 2017 dollars. The black boxes indicate the percentage of the cumulative maximum of FDA-approved drugs reached per year. The yearly statistics from ChemDB (number of publications, number of targets, number of target references, and number of compounds, overlaid lines) are graphed as a percentage of the maximum value for each metric (see Methods). Underlying data are available in Table A1. Note that a change in programmatic funding reporting led to a substantial reduction in funds reported for HIV therapeutics development from 2017 onward [12,13].
