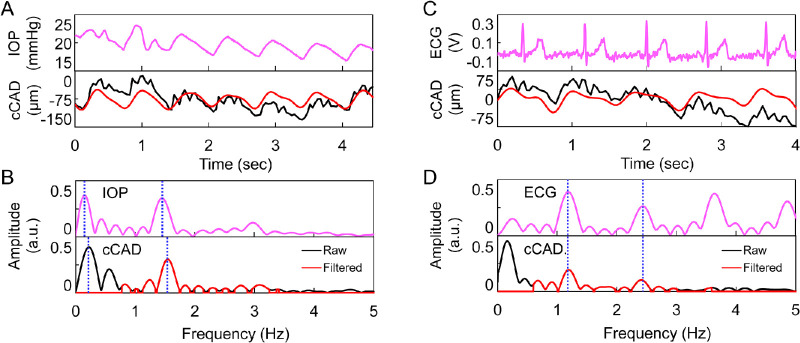
Figure 4.
(A, B) Comparison of asynchronously recorded dynamic IOP and cCAD in one subject. (A) Top: dynamic IOP. Bottom: raw (black) and band-pass filtered (red) cCAD. (B). Top: frequency spectrum of dynamic IOP. Bottom: frequency spectrum of raw cCAD (black) overlaid with the filtered frequency spectrum (red). (C, D) Comparison of synchronously recorded ECG and cCAD in another subject. (C) Top: raw ECG signal. Bottom: raw (black) and band-pass filtered (red) cCAD. (D) Top: frequency spectrum of ECG. Bottom: frequency spectrum of raw cCAD (black) overlaid with the filtered frequency spectrum (red), where a constant offset was removed. The dotted vertical lines indicate the first two harmonics.

