Figure 5.
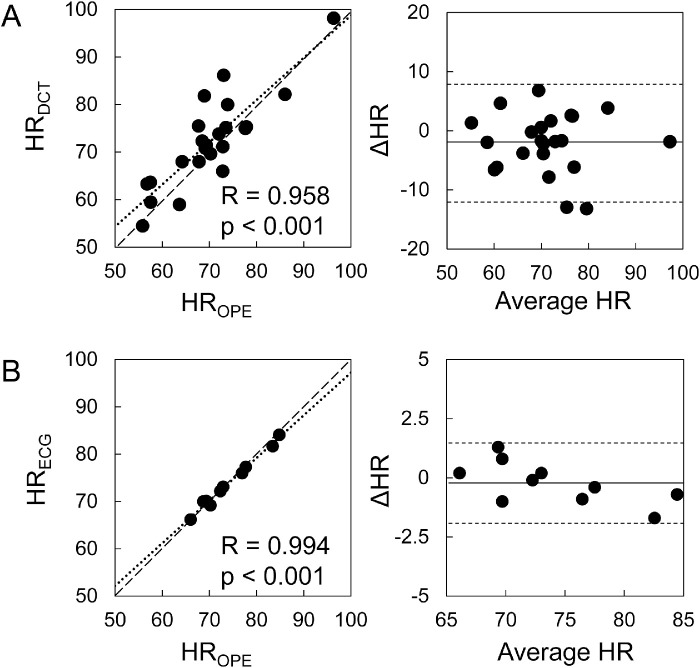
Scatter plots showing strong correlations between the HR calculated from OPE and the outputs of asynchronous DCT (n = 23) (A) and synchronous ECG (n = 10) (B). Bland-Altman plots show agreement between HR measured by OPE and the other techniques. OPE and DCT measurements were averaged between OD and OS.

