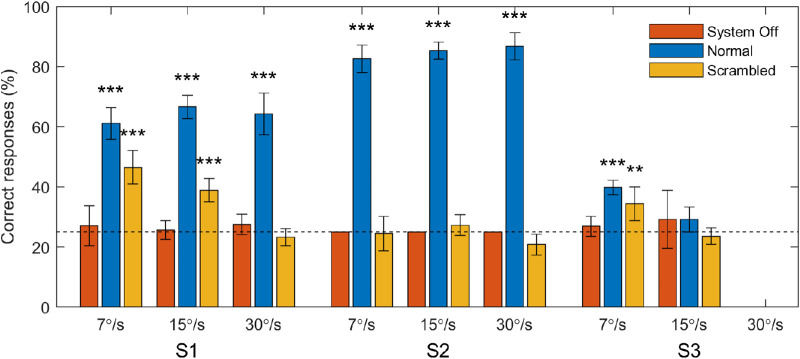
Figure 2.
Percent of correct responses for each subject in the moving bar task. Bars represent score pooled across all sessions. Error bars represent the standard error of the mean of the score per session. Data are separated by the speed at which the stimulus moved and by the image processing condition (normal, scrambled, system off). The horizontal dotted line specifies the chance rate of 25%. Asterisks denote above-chance performance for data pooled across sessions (binomial test, **P < 0.01, ***P < 0.001).

