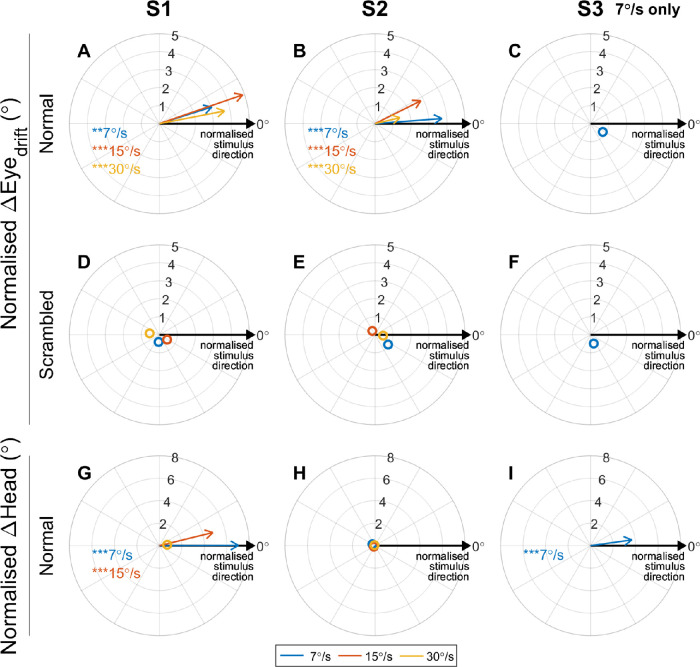
Figure 4.
Polar plots displaying the angular error between the direction of motion of the stimulus and the average ΔEyedrift and ΔHead for all subjects in the Normal and Scrambled conditions for 7°/s (blue), 15°/s (red), and 30°/s (yellow) stimuli. Each vector represents the mean direction and magnitude of the eye or head movement relative to the direction of motion of the stimulus. Vectors pointing approximately rightward (0°) indicate that on average the eye or head movement was in the same direction as the stimulus (for all stimulus directions). Asterisks indicate mean eye or head movement was significantly different to zero (Hotelling's one sample t-test with Bonferroni correction for multiple comparisons; *P < 0.05, **P < 0.01, ***P < 0.001). Hollow markers denote mean eye/head movements that were not significantly different to zero, indicating little movement or nonsystematic movement.

