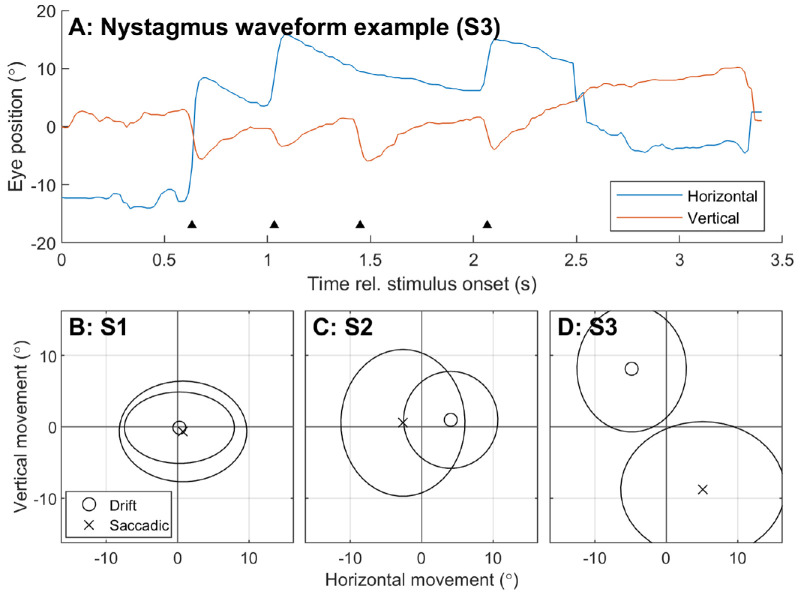
Figure 5.
Characterization of baseline acquired nystagmus for each subject using eye movement during the moving bar task in the system off condition. Data was pooled across all stimulus speeds. (A) Example of a nystagmic waveform in S3. Black triangles indicate the beat (saccadic component) of the nystagmus. (B–D) Mean ΔEyedrift (circle markers) is compared to mean ΔEyesaccadic (crosses) for each participant. Ellipses indicate standard deviation. Slow and fast phase movements with opposing polarity indicate a beating nystagmus. S1 had no notable nystagmus, S2 exhibited a left-beat nystagmus, and S3 exhibited a down-beat nystagmus.

