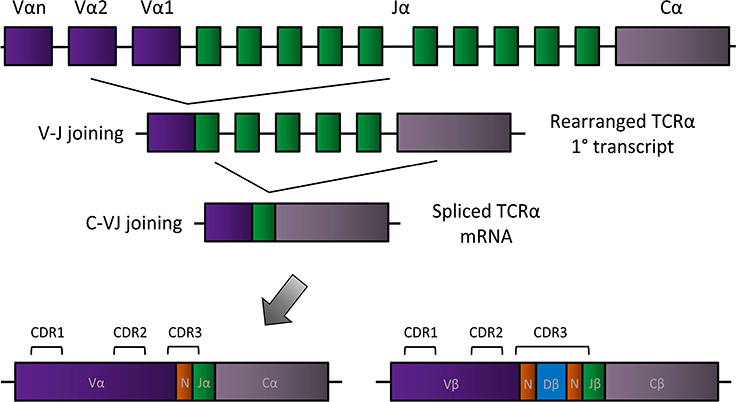
Figure 3. TCR rearrangement.
A simplified model of TCR rearrangement is displayed for the TCRα chain in which Vα segments (purple, continuing to the left), Jα segments (green), and the Cα constant region join together to form functional α chains of TCRs. In the first step, one Vα segment and one Jα segment come together in a randomized process, and in the second step, the VαJα joins the constant region (Cα), which is identical for all TCRα chains. The bottom row shows the location of the three complementary-determining regions (CDRs) of the rearranged TCRα chain. Because random nucleotides are added and deleted at each step, the CDR3 region encompasses the area in which those additions and deletions occurred (N). The rearranged TCRβ chain is shown on the bottom right. Rearrangement of the TCRβ chain is identical to that of the TCRα chain except that there is an additional segment (Dβ), giving rise to two N regions in the final β chain.

