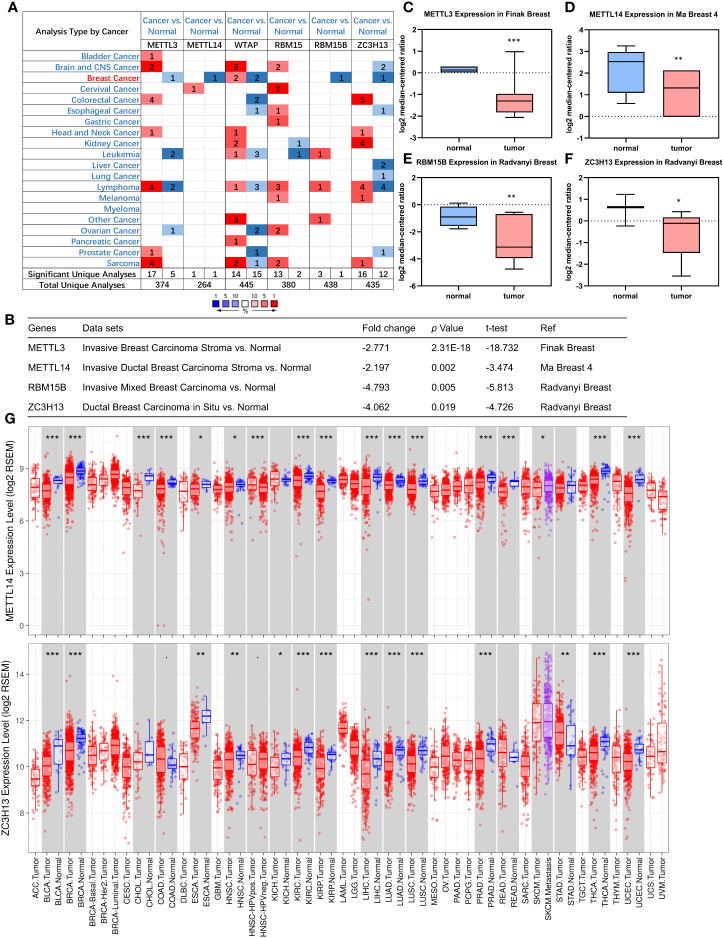
Figure 1.
Down-regulation of METTL14 and ZC3H13 mRNA expression in breast cancer. (A) Oncomine database indicates the numbers of datasets with statistically significant overexpressed mRNA (red) or downexpressed (blue) of METTL3, METTL14, WTAP, RBM15, RBM15B, and ZC3H13 (cancer tissues vs normal tissues). (B–F) The expression of METTL3, METTL14, RBM15B, and ZC3H13 in breast cancer tissues vs normal control in the datasets of Oncomine database. (G) The expression of METTL14 and ZC3H13 in cancer tissues and normal control in the TCGA database generated by TIMER database. ***P < 0.001, **P < 0.01, *P < 0.05.

