Figure 8.
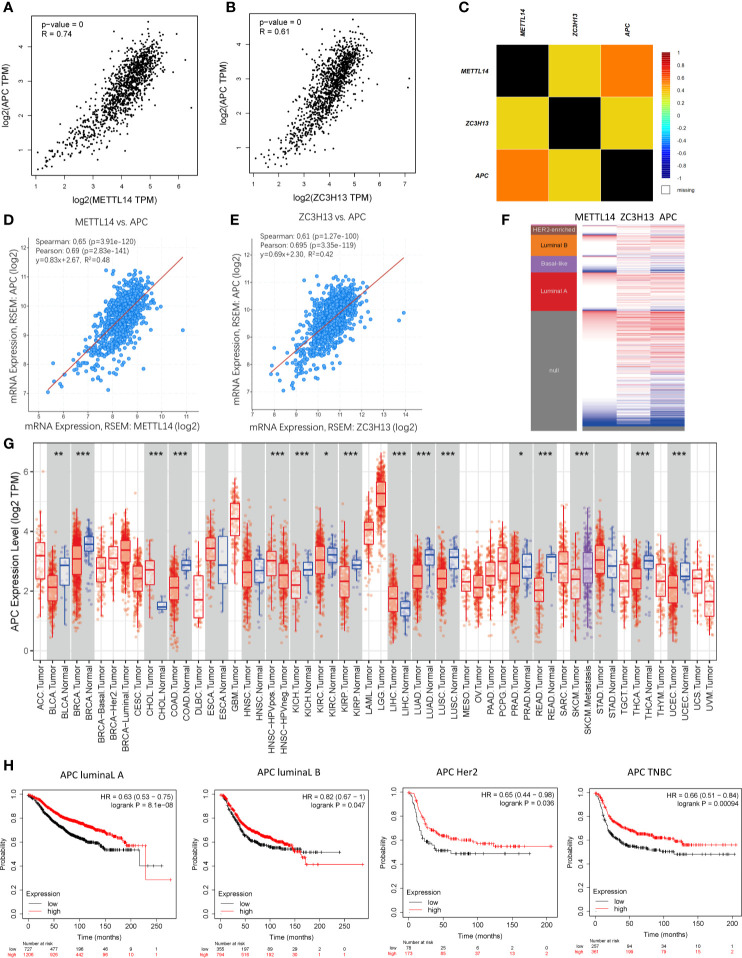
Co-expression of APC and METTL14, ZC3H13. (A, B) The correlation between APC and METTL14, ZC3H13 mRNA expression determined using GEPIA. (C) The relationship between APC and METTL14, ZC3H13 in breast cancer analyzed using bc-GenExMiner v4.0. (D, E) The correlation between APC and METTL14, ZC3H13 mRNA expression via the cBioPortal online database (TCGA, PanCancer Atlas). (F) Heat map of APC expression and METTL14, ZC3H13 mRNA expression across PAM50 breast cancer subtypes in the TCGA using UCSC Xena. (G) The expression of APC in cancer tissues and normal control in TCGA database generated by TIMER database. (F) The RFS curves of APC gene expression in four types breast cancer patients, including luminal type A, luminal type B, HER2 enriched type and triple negative type (TNBC). ***P < 0.001, **P < 0.01, *P < 0.05.

