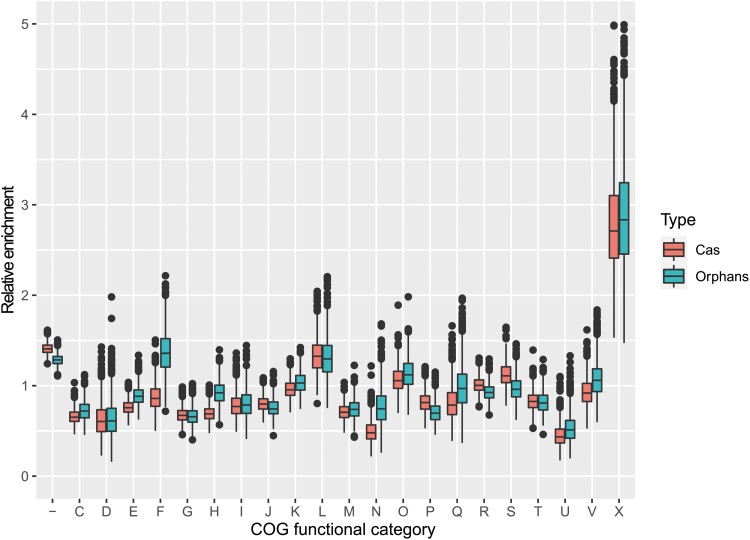
FIG. 4.
Functional classes of genes in the vicinity of CRISPR-Cas systems and isolated arrays. The box plot shows the enrichment/depletion ratios of genes from different functional classes of COGs in the genomic regions upstream and downstream of CRISPR-cas loci (red boxes) and isolated arrays loci (blue boxes) relative to genes randomly sampled from the same genomes (1,000 bootstrap replications). The boxes shows the 25th/50th/75th percentiles, and black dots shows outliers that fall above 1.5 × interquartile range (IQR). x-Axis: functional classes of COGs (“–” indicates genes that were not recognized by any COG profiles); y-axis: enrichment/depletion ratio. Functional classes of genes are as follows: −, not recognized; C, energy production and conversion; D, cell cycle control, cell division, chromosome partitioning; E, amino acid transport and metabolism; F, nucleotide transport and metabolism; G, carbohydrate transport and metabolism; H, coenzyme transport and metabolism; I, lipid transport and metabolism; J, translation, ribosomal structure, and biogenesis; K, transcription; L, replication, recombination, and repair; M, cell wall/membrane/envelope biogenesis; N, cell motility; O, posttranslational modification, protein turnover, chaperones; P, inorganic ion transport and metabolism; Q, secondary metabolites biosynthesis, transport, and catabolism; R, general function prediction only; S, function unknown; T, signal transduction mechanisms; U, intracellular trafficking, secretion, and vesicular transport; V, defense mechanisms; X, mobilome: prophages, transposons; Z, cytoskeleton. COG, clusters of orthologous gene.

