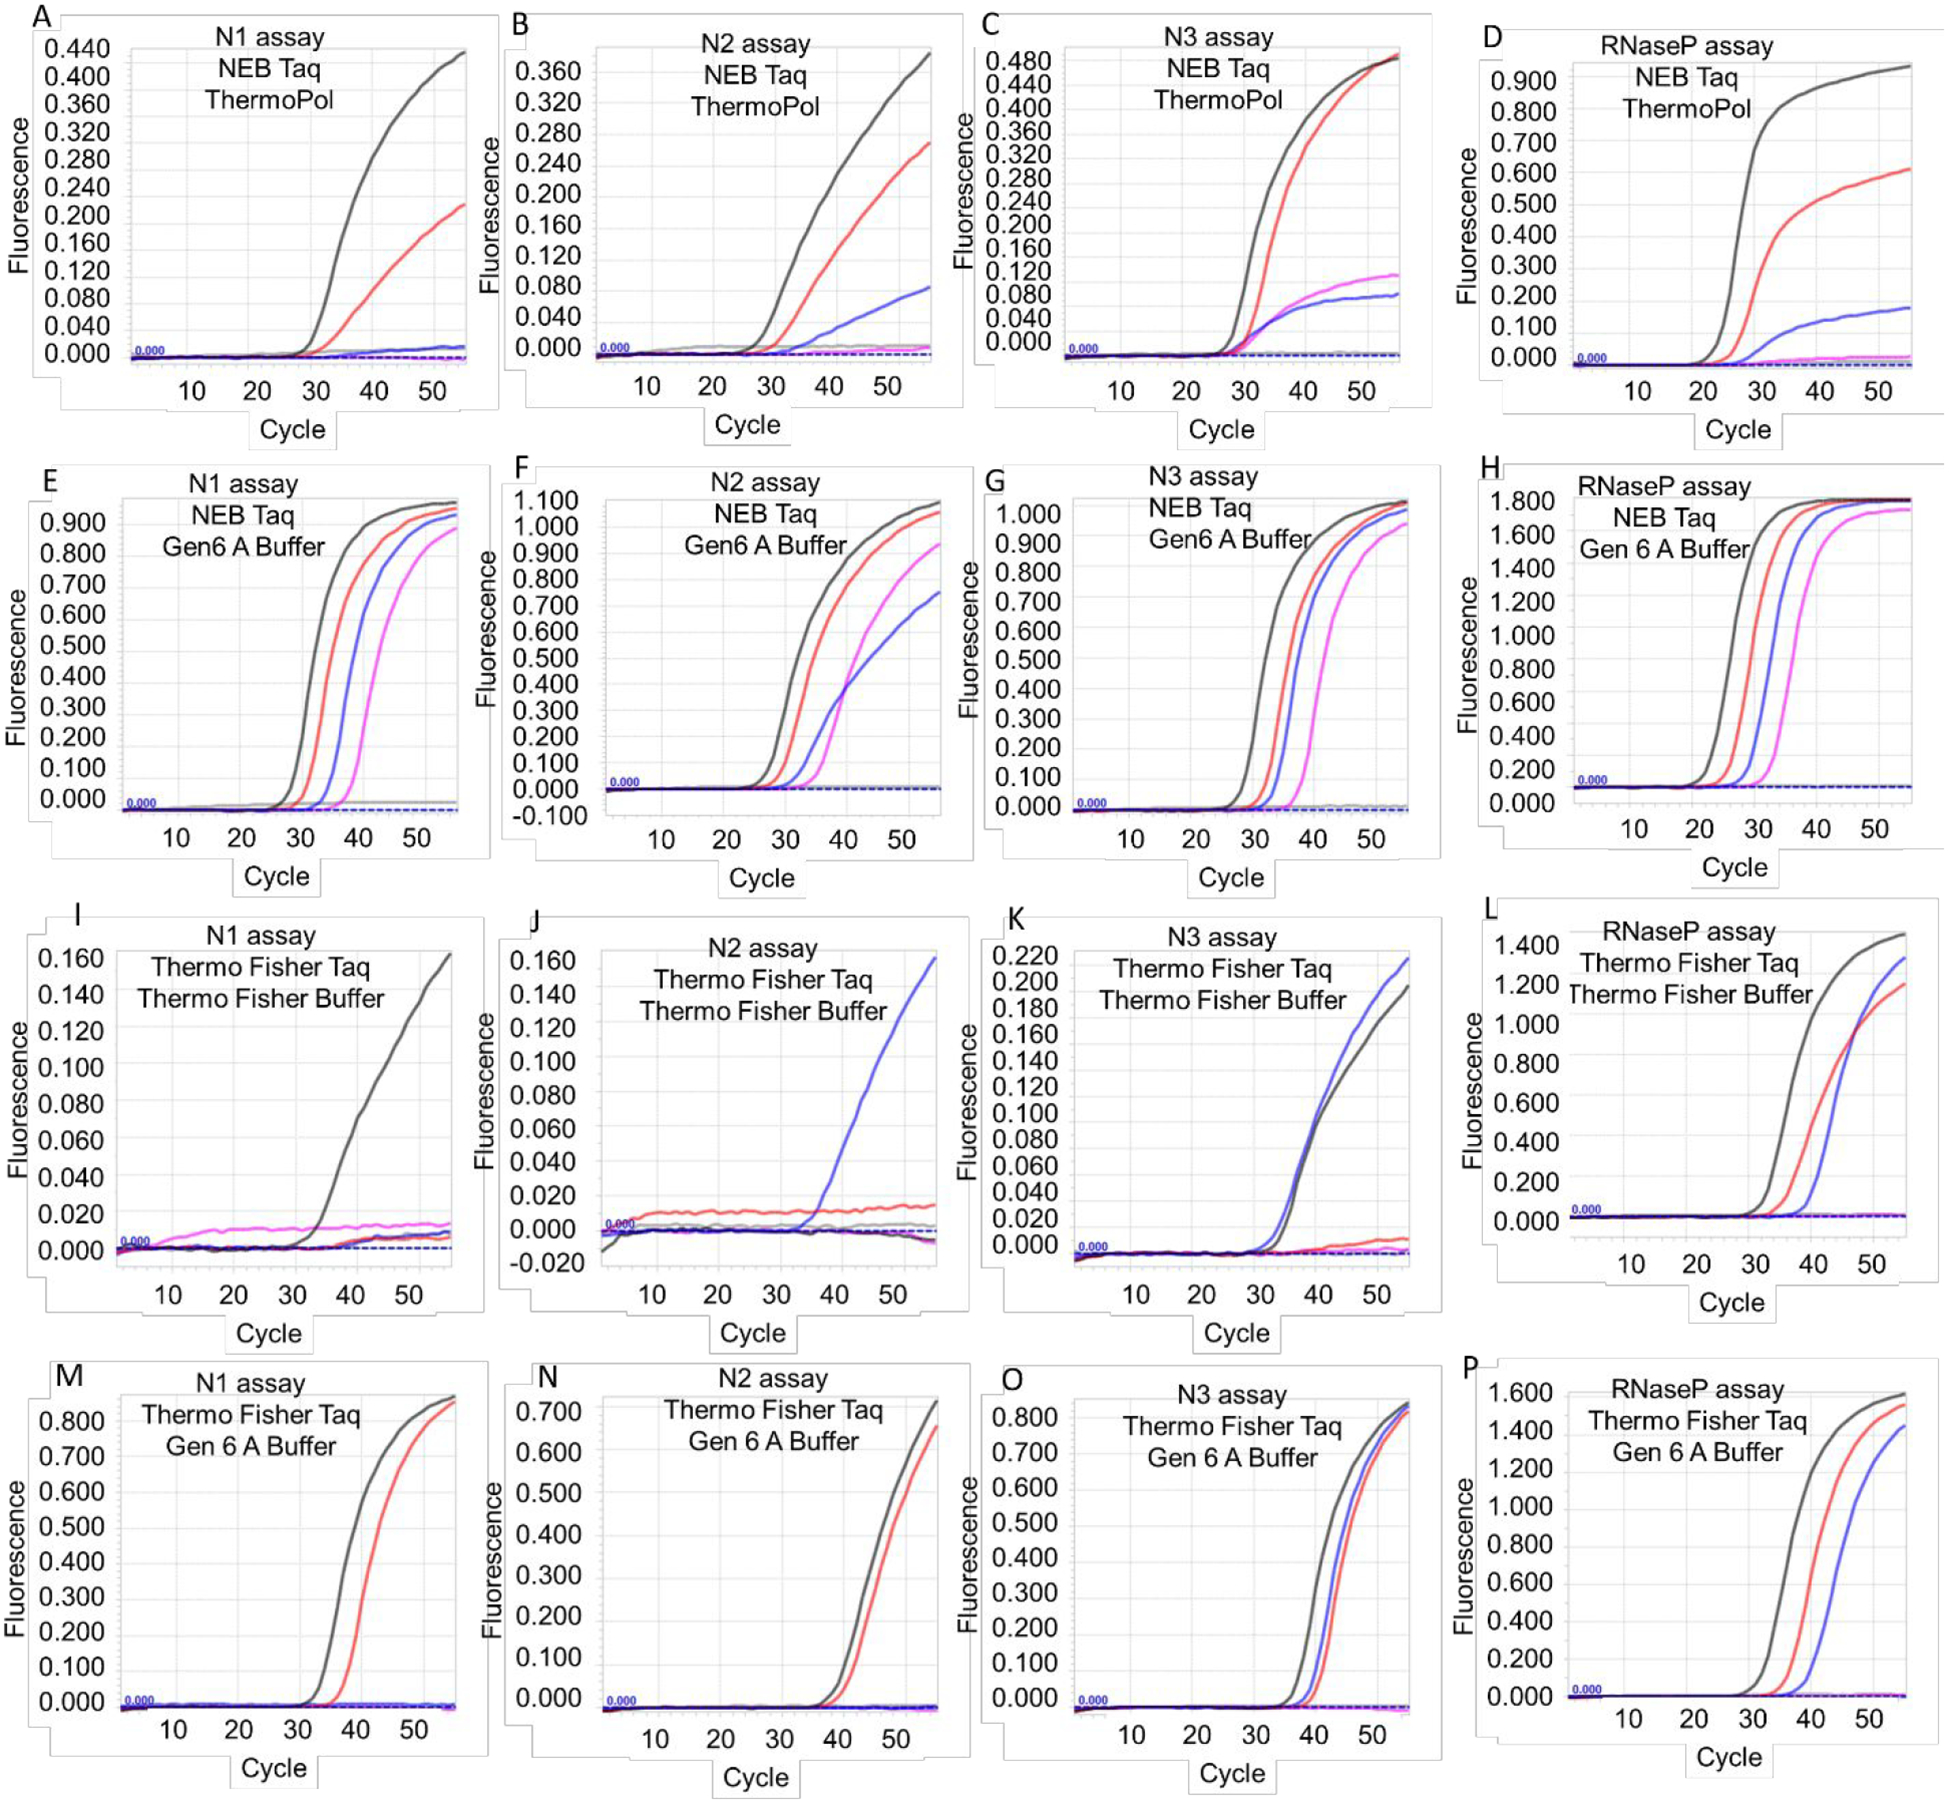
Figure 1.

SARS-CoV-2 N1 TaqMan RT-qPCR assays performed using NEB Taq DNA polymerase and N gene armored RNA in indicated buffers. Buffer compositions are detailed in Table 2. Representative amplification curves resulting from duplicate analysis of 3 × 10⁵ (black traces), 3 × 10⁴ (red traces), 3 × 10³ (blue traces), 3 × 10² (pink traces), 30 (green traces), and 0 (gray) copies of SARS-CoV-2 N gene armored RNA are depicted.
