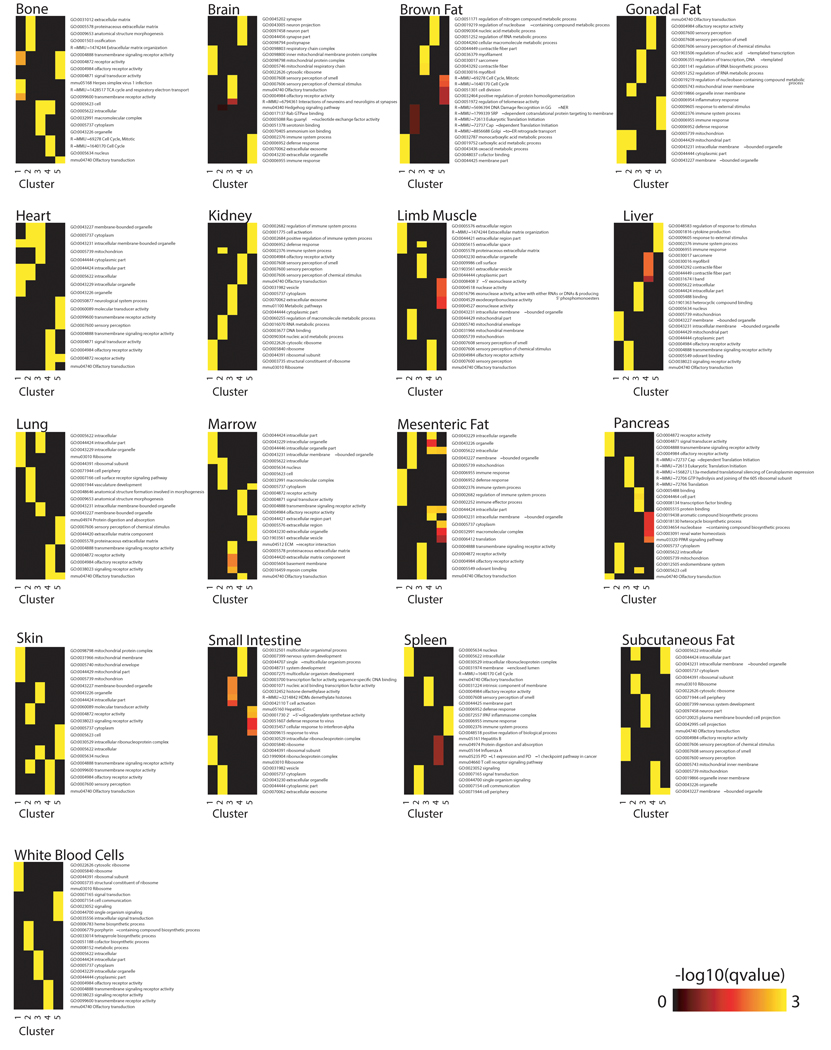
Extended Data Figure 6. Pathway enrichment analysis of organ-specific clusters.
Clusters from Extended Data Figure 5 show enrichment for genes in functional categories. Pathway enrichment was tested using GO, Reactome, and KEGG databases. Enrichment was tested using Fisher’s exact test (GO) and the hypergeometric test (Reactome and KEGG). The top 5 pathways for each cluster are shown. q-values estimated with Benjamini-Hochberg for each database separately, and for GO classes (molecular function, cellular component, biological process) independently. Sample size per cluster / tissue is indicated in Extended Data Figure 5.

