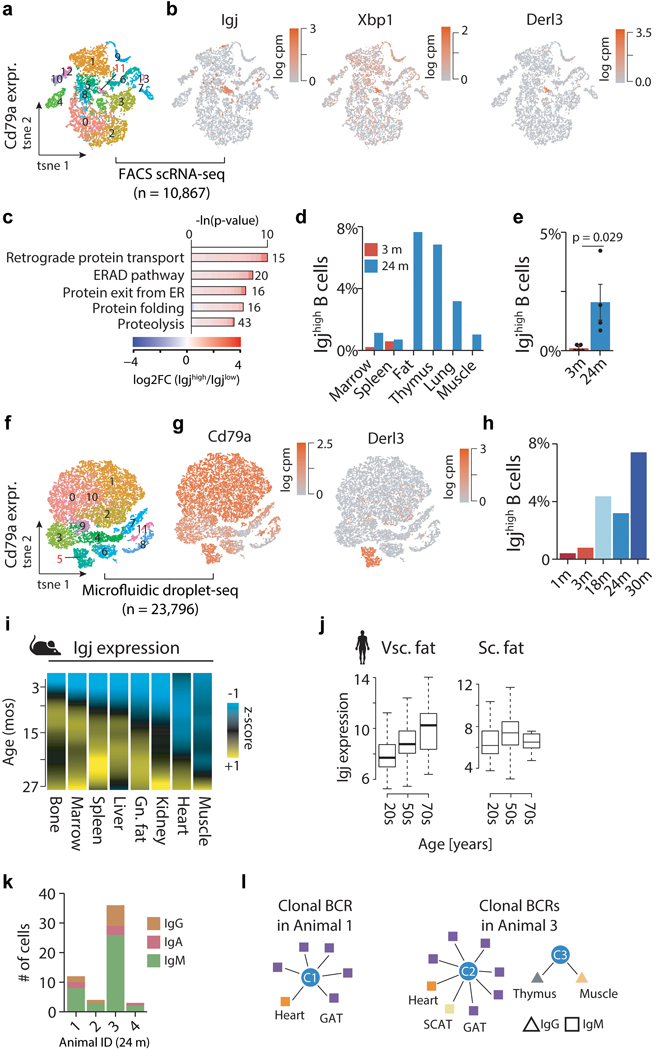
Extended Data Figure 9. Identifying Igjhigh B cells with FACS and droplet scRNA-seq.
a, t-SNE visualization of all Cd79a-expressing cells present in the Tabula Muris Senis FACS dataset (17 tissues). Colored clusters as identified with the Seurat software toolkit. Igjhigh B cell cluster 11 highlighted. n=10,867 cells. b, t-SNE in (a) colored by the Igjhigh B cell markers Igj, Xbp1 and Derl3. c, GO terms enriched among the top 300 marker genes of Igjhigh (n=129 cells) versus Igjlow(n=10,738 cells)(FACS). q-values estimated with Benjamini-Hochberg for each database separately, and for GO classes (molecular function, cellular component, biological process) independently. d, Distribution of Igjhigh as percentages of Cd79a expressing cells per tissue. e, Percentage of Igjhigh B cells of all Cd79a expressing cells across all tissues. n=5 (3mo) & n=4 (24mo) independent animals. T-test, means ± SEM. f, t-SNE visualization of all Cd79a-expressing cells present in the Tabula Muris Senis droplet dataset (17 tissues). Colored clusters as identified with the Seurat software toolkit. IgJhigh B cell cluster 5 highlighted. n=23,796 cells. g, t-SNE in (f) colored by the B cell marker Cd79a and Igjhigh B cell marker Derl3. h, Percentage of Igjhigh B cells of all Cd79a expressing cells across all tissues. i, Heatmap of the z-transformed Igj expression trajectories across bone (n=54), marrow (n=51), spleen (n=54), liver (n=50), GAT (n=52), kidney (n=52), heart (n=52), muscle (n=52). j, mRNA expression change of Igj in human visceral fat (20s n=25; 50s n=124; 70s n=12) and subcutaneous fat (20s n=32; 50s n=149; 70s n=13) (data from GTEx consortium). Boxplot (median, 1st and 3rd quartiles). k, Number of Igjhigh B cells with successfully assembled B cell receptor locus, split by animal and immunoglobulin class. l, Clonally amplified Igjhigh B cells as detected in animal 1 and 3, grouped by tissue of origin (color) and immunoglobulin class (shape).

