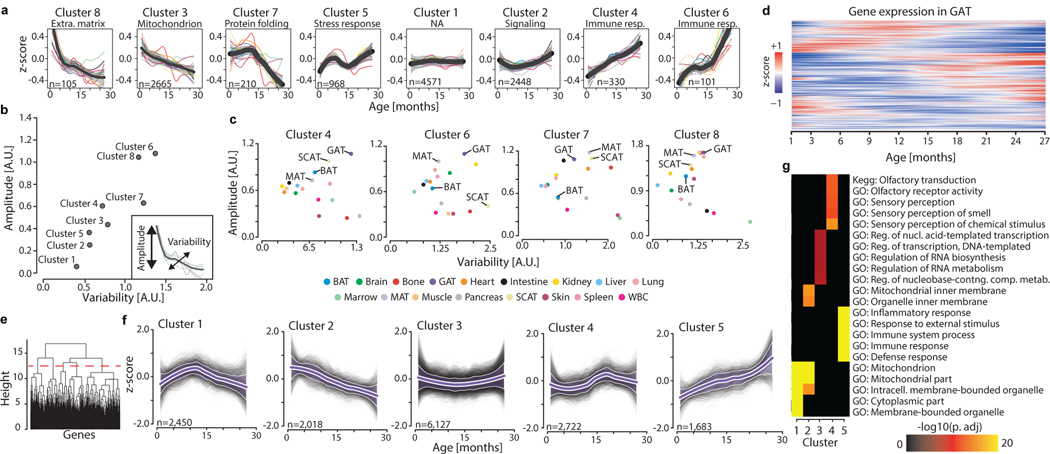
Figure 2. Aging gene expression dynamics across organs.
a, Whole-organism gene expression trajectory clustering. The trajectory for each gene was averaged across all 17 organs, and those average trajectories grouped into 8 clusters. The number of genes and the top functionally enriched pathway for each cluster are reported. Within each cluster, the average trajectory for each individual organ is overlaid. Cluster trajectories +/− standard deviation (n=17 tissue trajectories) are indicated in black and grey. Enrichment was tested using Fisher’s exact test (GO) and the hypergeometric test (Reactome and KEGG). Q-values estimated with Benjamini-Hochberg for each database separately, and for GO classes (molecular function, cellular component, biological process) independently. b, Identification of stable and variable clusters between organs. For each cluster in (a), an amplitude and variability index were calculated. c, The 4 clusters changing the most in (b) are represented, and adipose tissues are indicated. d, Unsupervised hierarchical clustering was used to group genes with similar trajectories in GAT (n=15,000 most highly expressed genes). e, Clustering dendrogram and cut-off used to define 5 independent clusters in GAT. f, Gene trajectories of the 5 clusters in (e) are represented in grey. Purple lines surrounded by white represent the average trajectory for each cluster, +/− standard deviation (n genes indicated for each cluster). g, The top 5 pathways for each cluster in (e). n genes as in (e), with the 15,000 most highly expressed genes as background. Enrichment and q-values as in (a).

