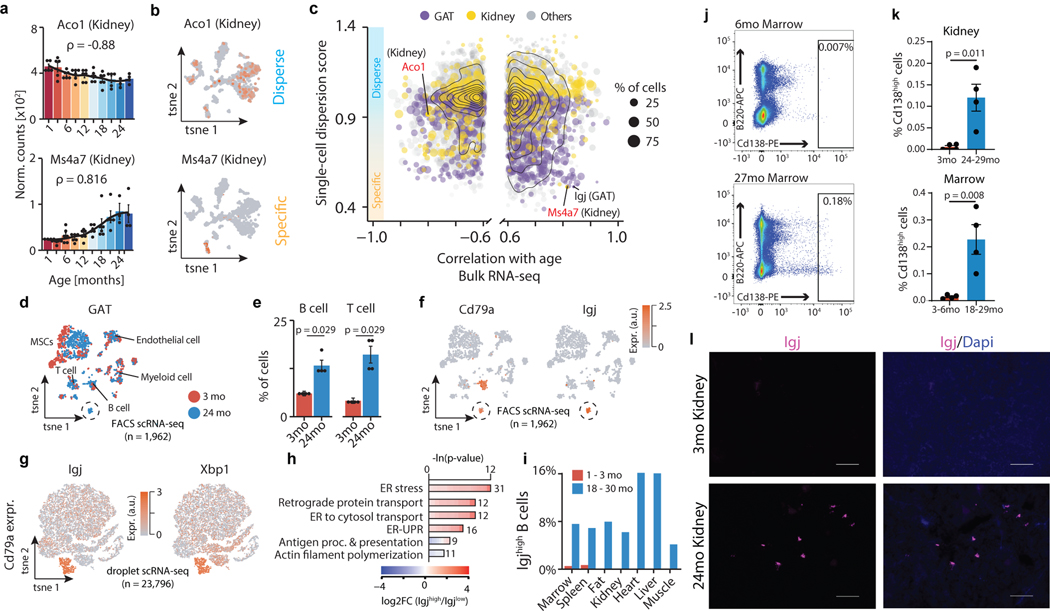
Figure 3. Integration of bulk and single-cell transcriptomic data identifies cross-tissue infiltration of Igjhigh plasma B cells.
a, Aco1 and Ms4a7 kidney mRNA expression. LOESS regression indicated by black line. Spearman’s rank correlation coefficient ρ is indicated. Means ± SEM. b, A gene with ‘disperse’ (Aco1) and ‘specific’ (Ms4a7) single-cell expression pattern in kidney. n=1,108 cells. c, Single-cell dispersion scores (scRNA-seq) with Spearman’s rank correlation coefficient (≥ 0.6; bulk RNA-seq) for a given tissue. Color represents organ type. Dot size corresponds to % of cells per tissue expressing a given gene. d, t-SNE visualization of scRNA-seq data (FACS) from GAT, colored by age. A cluster of B cells present only in aged GAT is circled. e, GAT B and T cells as a percentage of all analyzed cells. n=4 independent animals. T-test, means ± SEM. f, Expression of B cell marker Cd79a and plasma B cell marker Igj. g, t-SNE visualization of scRNA-seq data (droplet) of all Cd79a-expressing cells present in the Tabula Muris Senis dataset (17 tissues), colored by the plasma B cell markers Igj and Xbp1. h, GO terms enriched among the top 300 marker genes of Igjhigh (n=1,198 cells) versus B cells (n=22,598 cells), with 1,886 genes passing filtering as background. q-values estimated with Benjamini-Hochberg for each database separately, and for GO classes (molecular function, cellular component, biological process) independently. i, Distribution of IgJhigh as percentages of Cd79a expressing cells per tissue. j, Representative FACS scatterplots from 2 independent experiments showing increased plasma cell abundance in aged bone marrow. Cd138, plasma cell marker. B220, B cell marker. k, FACS quantification for kidney and marrow. n=4 independent animals. T-test, means ± SEM l, Representative images from 2 independent experiments of Igj RNAscope of 3mo and 24mo kidney. Virtually no Igj signal was present in young kidneys. 100μm scale bar.

