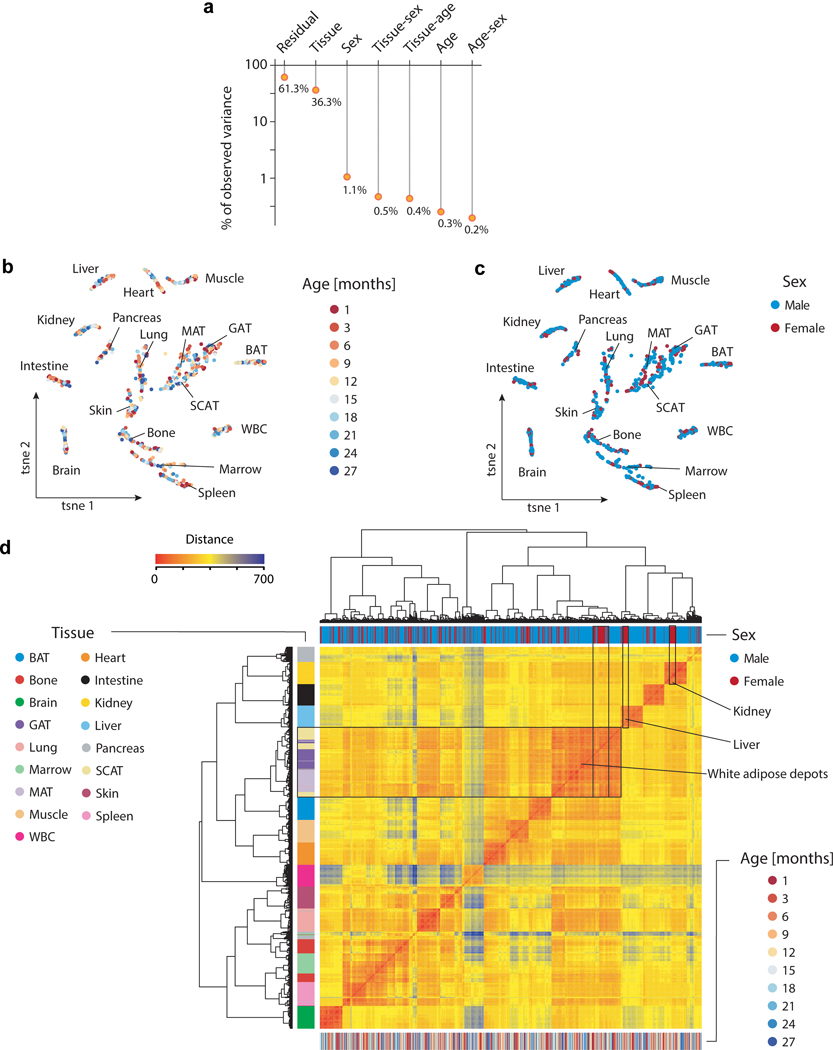
Extended Data Figure 1. Gene expression variance analysis.
a, Visualization of the Principal Variance Component Analysis, displaying the gene expression variance explained by residuals (i.e. biological and technical noise) or experimental factors such as tissue, age, sex, and respective combinations. n=904 total samples b, c, t-SNE visualization of all samples, based on the first 6 principal components colored by age (b) and sex (c). d, Hierarchical clustering of all samples using Ward’s algorithm. Samples are annotated by tissue, sex and age. Highlighted are samples clustering by sex in selected tissues. Non-specific clustering of samples derived from white adipose tissues is further highlighted.

