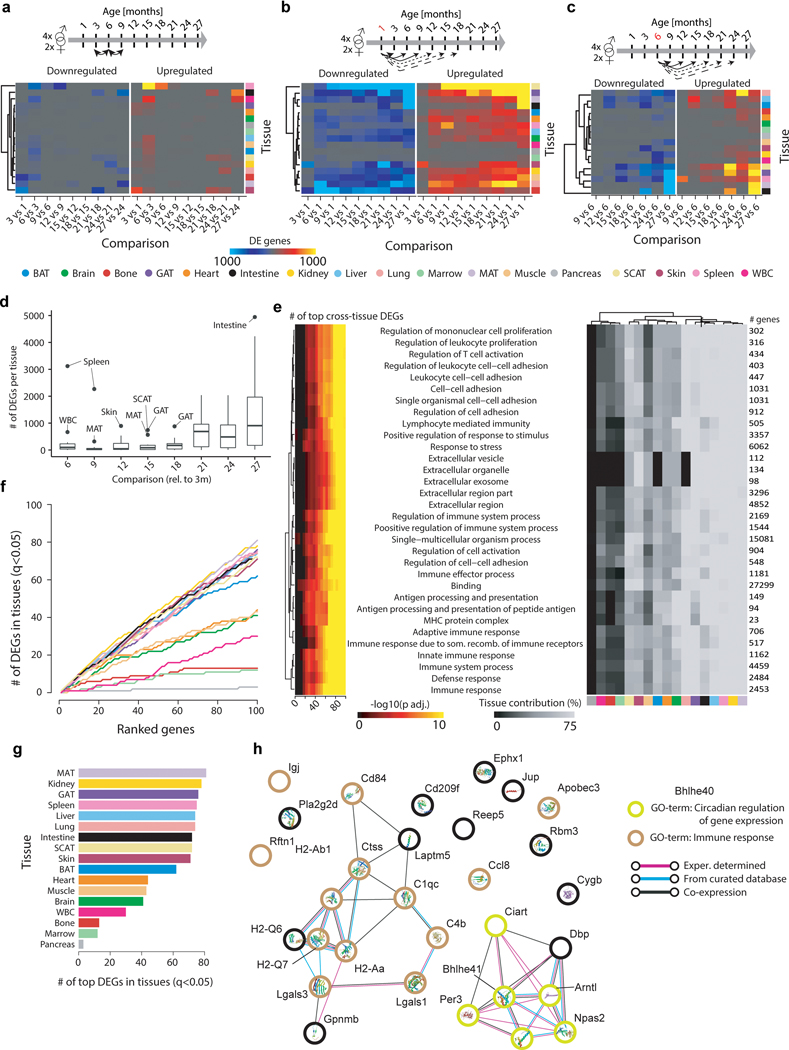
Extended Data Figure 2. Validation of differential gene expression analysis.
a, Heatmap displaying the number of DEGs per tissue for pairwise analysis on adjacent time points. b, Heatmap displaying the number of DEGs per tissue for pairwise comparisons with a 1mo reference. c, Heatmap displaying the number of DEGs per tissue for pairwise comparisons with a 6mo reference. d, Boxplot (mean, 1st & 3rd quartiles) representation displaying the number of DEGs per tissue (n=17 tissues) for pairwise comparisons with a 3mo reference. Outliers show tissues undergoing exceptionally strong expression shifts at a given age. e, Enrichment for functional categories in the top100 genes differentially expressed in the most tissues (ranked using pairwise comparisons with a 3mo reference). Pathway enrichment with GO, Reactome, and KEGG databases. Enrichment was tested using Fisher’s exact test (GO) and the hypergeometric test (Reactome and KEGG). To estimate the contribution of each tissue, we used the number of genes per pathway in the top100 DEGs and estimated the percentage of significant genes per tissue. q-values estimated with Benjamini-Hochberg for each database separately, and for GO classes (molecular function, cellular component, biological process) independently. n as in (d). f, Cumulative sum of DEGs per tissue in the ranked top100 genes. g, Number of DEGs per tissue in the top100 genes. n=54 (MAT), 52 (kidney), 52 (GAT), 54 (spleen), 50 (liver), 54 (lung), 50 (intestine), 55 (SCAT), 51 (skin), 53 (BAT), 52 (heart), 52 (muscle), 53 (brain), 52 (WBC), 54 (bone), 51 (marrow), 46 (pancreas). q-values as in (e). h, STRING analysis of the top 30 genes in Figure 1g.

