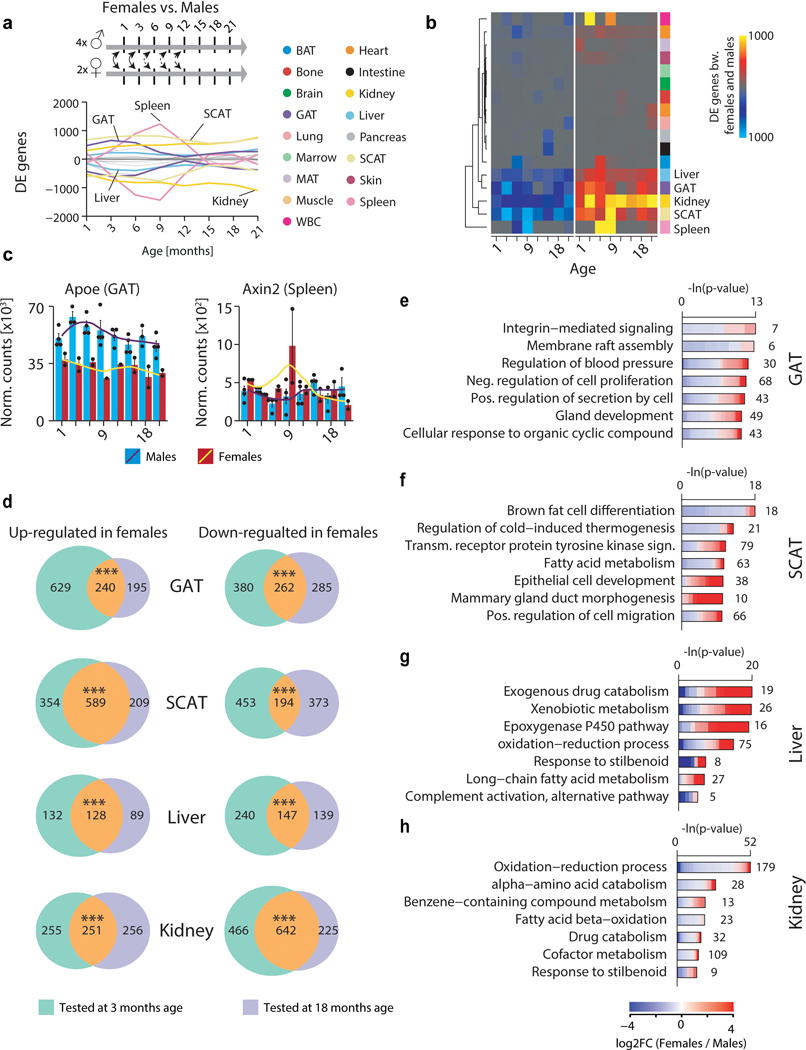
Extended Data Figure 4. Sex-specific expression changes across organs.
a, Smoothed lineplot displaying the number of DEGs between female and male animals at each age. Positive (negative) values represent up-regulated (down-regulated) genes. Grey lines: all other tissues. b, Heatmap representation of (a). c, mRNA expression of Apoe in GAT and Axin2 in spleen. Black line: LOESS regression. n=45 (GAT) and n=47 (spleen) independent samples. d, Venn diagrams depicting the overlap of DEGs between females and males detected at 3mo and 18mo of age in GAT, SCAT, liver and kidney. One-sided Fisher’s exact test. *** P<0.0001. e-h, Top 10 GO terms enriched among the DEGs between females and males at 18mo of age in GAT (e), SCAT (f), liver (g) and kidney (h). Means ± SEM. n=2 (females) & n=4 (males) independent animals for each organ. q-values estimated with Benjamini-Hochberg for each database separately, and for GO classes (molecular function, cellular component, biological process) independently.

