Fig. 2.

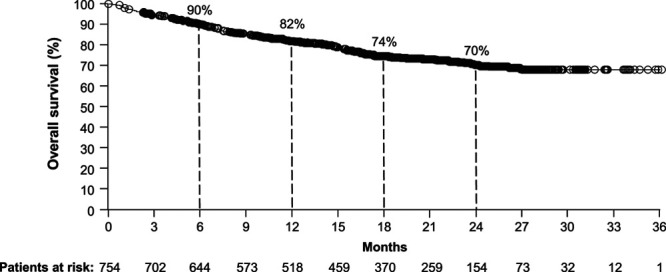
Survival outcomes in the overall population. Kaplan–Meier curves are shown for the overall population (190 events/754 patients) with a median OS not available (minimum follow-up not reached). OS, overall survival.

Survival outcomes in the overall population. Kaplan–Meier curves are shown for the overall population (190 events/754 patients) with a median OS not available (minimum follow-up not reached). OS, overall survival.