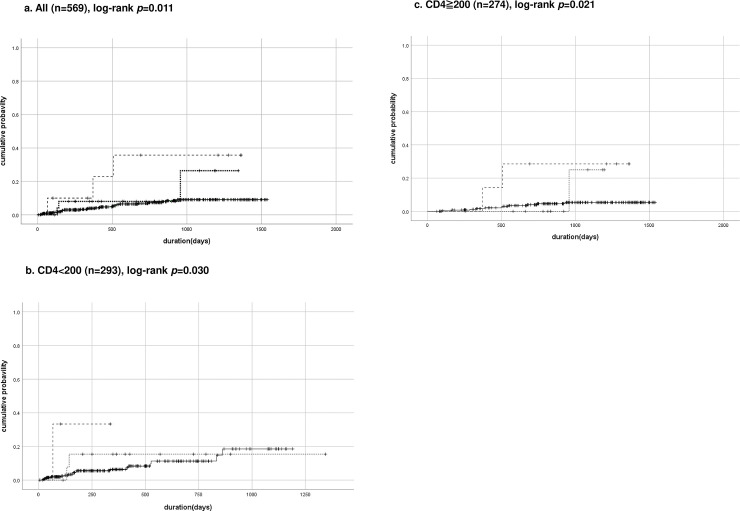
Fig 1. Cumulative probability curves of PCP during follow-up periods.
Kaplan–Meier curves for registered Pneumocystis jirovecii Pneumonia (PCP) patients. (a) Total patients (n = 569), (b) baseline CD4 count <200/μl (n = 293), and (c) baseline CD4 count ≧200/μl (n = 274). Dashed line indicates deficient expression type of Mannose-binding Lectin (MBL), dotted line indicates low and solid line indicates high/intermediate MBL expression types combined. The log-rank test was used to compare group.

