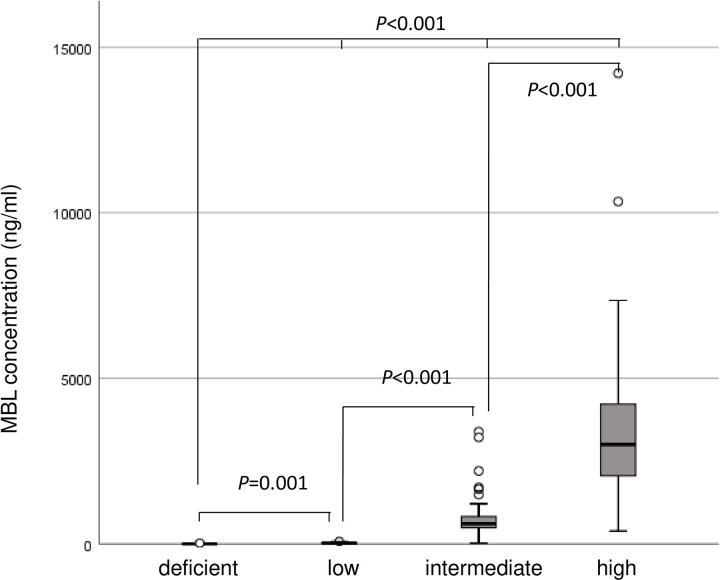
Fig 2. Box plots of plasma MBL concentrations of patients (n = 273) according to MBL expression type.
Box plots of plasma Mannose-binding Lectin (MBL) concentrations of patients (n = 273) according to MBL expression type. The Mann–Whitney U test and Kruskal–Wallis test were used for analyzing the differences of plasma MBL concentrations in each MBL expression type.

