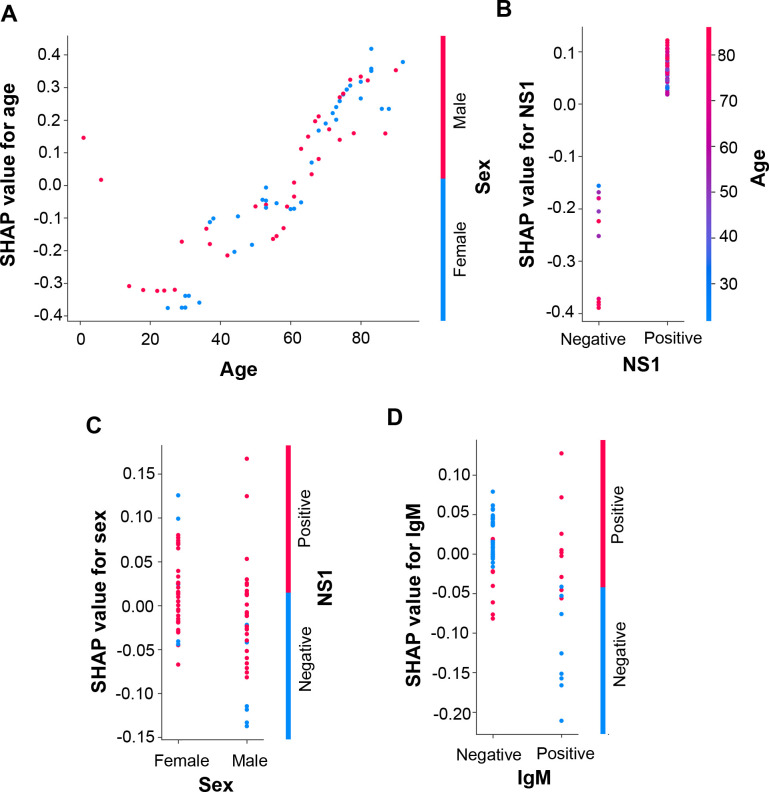
Fig 3. Dependence plots of the ANN model using SHAP explainer.
Dependence plots of the ANN model showed the potential cooperative effects of feature pairs on prediction outcomes. For each feature, its most associated feature was chosen to be analyzed using dependence plots. The feature pairs included (A) age and sex, (B) NS1 and age, (C) sex and IgM, and (D) IgM and IgG.

