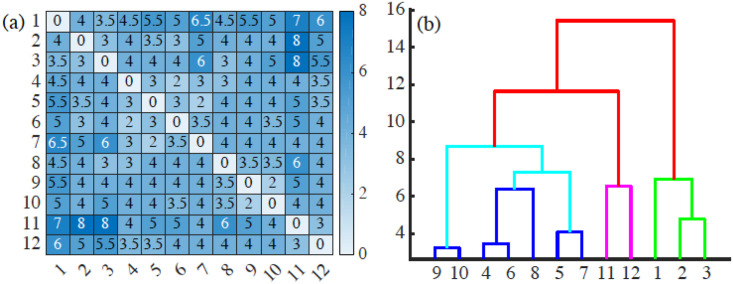
Fig 18. (a) Bottleneck distance matrix for the interfaces between cells populations appearing in the 12 snapshots forming S5 Video and (b) associated dendrogram illustrating how the interfaces between cell populations can be grouped in clusters.
Interfaces in frames 1-3, 4-10, 11-12 can be grouped together, and the last two groups are closer to each other than to the initial frames. These groupings reflect similarities between frames as they succeed one another, and the disruptions between frames reflect significant topological changes of the interfaces (e.g., detachment and reattachment of islands). S5–S16 Data have been used to draw this figure.

