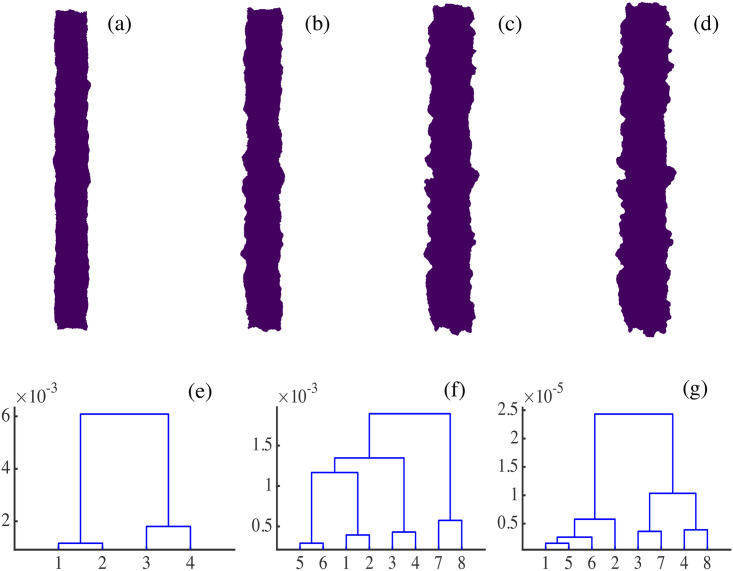
Fig 25.
(a)-(d) Consecutive snapshots of the evolution of the spreading configuration in Fig 4. (e)-(g) Dendrograms for hierarchical clustering constructed using Wasserstein distances W1,∞ between the four snapshots. We distinguish between overall snapshots (numbered 1 to 4) in Panel (e), and half snapshots representing right (numbered 1 to 4) and left (numbered 5 to 8) moving interfaces in Panels (f) and (g). (e) The smoother overall snapshots 1 and 2 (corresponding to Panels (a) and (b)) are clustered together and, likewise, the rougher overall snapshots 3 and 4 of Panels (c) and (d). (f) The Wasserstein distance clusters together successive pairs of left and right fronts. (g) Dendrograms using the Betti number profiles b0(rmax) (analogous to those in Fig 24) calculated for the left and right interfaces of each snapshot. Note that the interfaces of the first two snapshots are clustered together because they have similar roughness levels.

