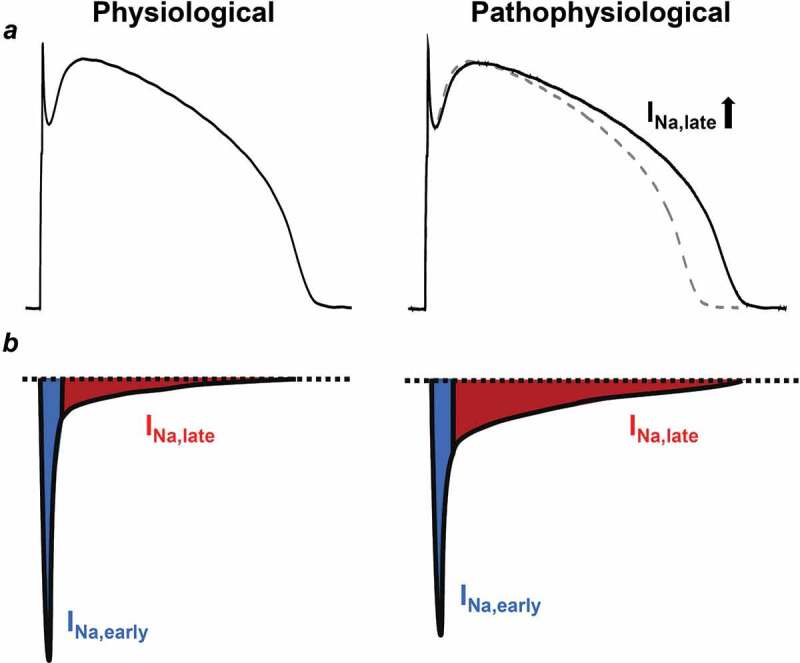
Figure 1.

Comparison of the physiological and the pathological INa,late in ventricular cardiomyocytes. (a) Ventricular action potentials recorded from healthy and diseased hearts. Diseased INa,late is increased causing a longer action potential. Dashed line shows the control action potential. (b) Representative electrophysiological recordings of the INa in normal and diseased myocytes. Blue shows the early, peak component of the INa (INa,early), while red shows the sustained, late component of the current (INa,late)
