
Figure 4. Deposition of Fg and expression of PrPC, and their co-localization in brain of mice treated with fibrinogen antisense oligonucleotide (Fg-ASO) after CCI.
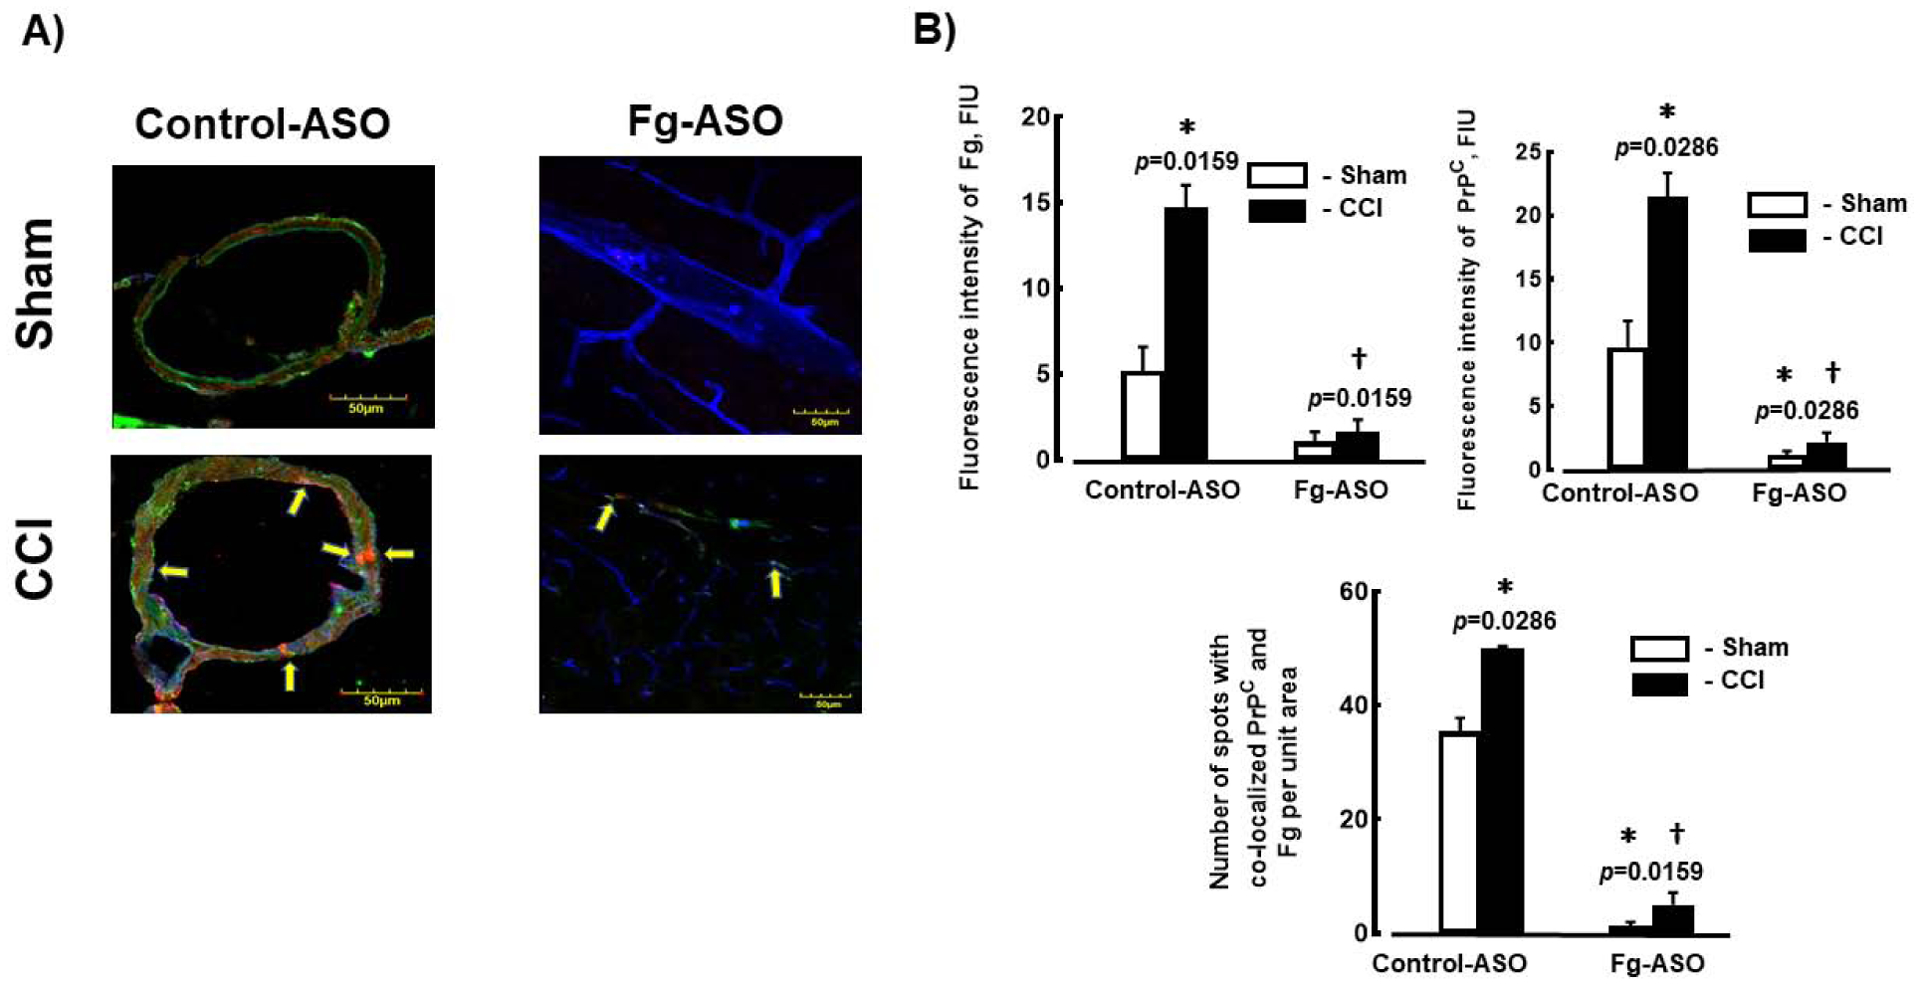
A) Examples of images showing expression of PrPC (green) and deposition of Fg (red), and their co-localization in mouse cortical vessels. Lycopersicon esculentum lectin, a marker of endothelium is shown in blue. Samples were collected 14 days after CCI or sham-operation.
B) Data analysis of fluorescence intensities of Fg and PrPC (presented as fluorescence intensity) are shown in the upper two plots. Co-localization of Fg and PrPC was assessed as a number of spots of co-localized respective fluorophores.
P<0.05 in all; * - vs. Sham Control-ASO, † - vs. CCI Control-ASO n=4/group. Mann-Whitney statistical test was used to define the difference between the groups.