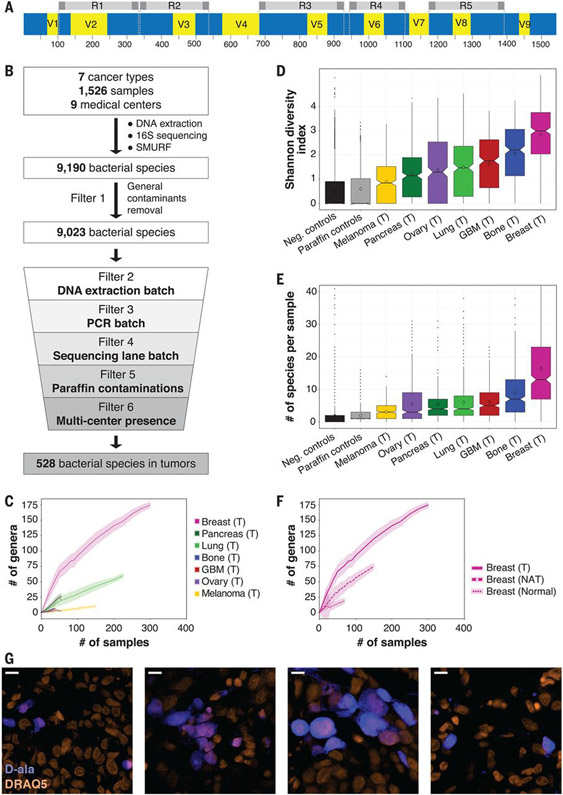
Fig. 3. The microbiome of breast tumors is richer and more diverse than that of other tumor types.
(A) Graphic representation of the bacterial 16S rRNA gene with its conserved (blue) and variable (yellow) regions. The sequence from Escherichia coli K-12 substrain MG1655 was used as a reference sequence. The five amplicons of the multiplexed 5R PCR method are depicted in gray. (B) Schematic representation of the analysis pipeline applied to 16S rDNA sequencing data. (C) Rarefaction plots showing the number of bacterial genera that passed all filters in the different tumor types per number of tumor samples that were selected for the analysis. Light color shading represents confidence intervals based on 100 random subsamplings for each number of tumor samples that was analyzed. (D) Box blot of Shannon diversity indexes of all samples, segregated by tumor type. Neg., negative. (E) Box blot of the numbers of bacterial species present in each tumor. For (D) and (E), values were calculated on rarefied data of 40 samples per tumor type, with 10 iterations. For each iteration, only bacteria that passed all filters in any of the tumor types were included in the analysis. (F) Rarefaction plots for the number of bacterial genera that passed all filters in breast tumor, breast NAT, and breast normal samples. Light color shading represents confidence intervals based on 100 random subsamplings for each number of samples that was analyzed. (G) Fluorescent images from four human breast tumors that were cultured ex vivo with fluorescently labeled D-alanine for 2 hours (blue). Nuclei were stained with DRAQ5 (orange). Scale bars, 10 μm.

