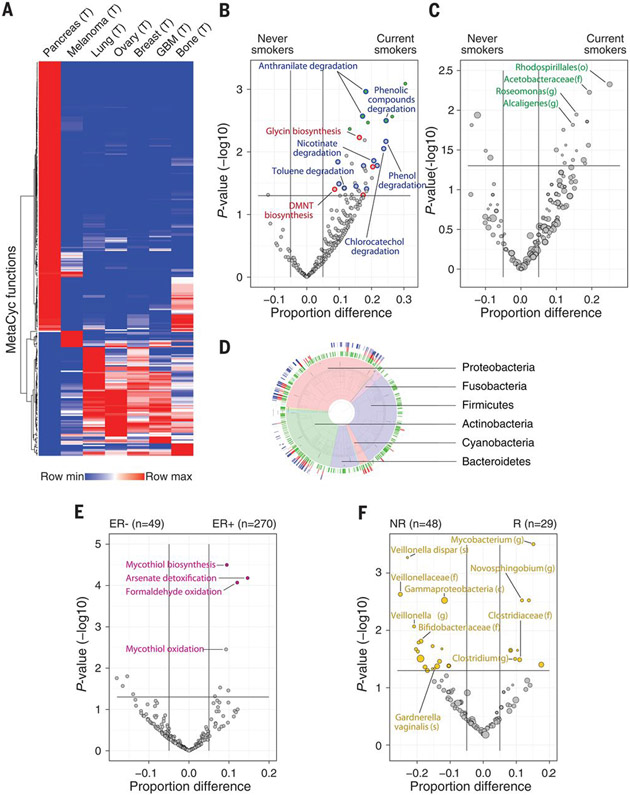
Fig. 5. Predicted bacterial metabolic functions are associated with clinical features.
(A) Heatmap demonstrating unsupervised hierarchical clustering of the frequencies of 287 MetaCyc pathways across the different tumor types. Only pathways that are abundant (frequency >10% in at least one tumor type) and variable (standard deviation divided by the average of frequencies >0.4) were included (table S10). (B and C) Volcano plots demonstrating bacterial MetaCyc pathways (B) and taxa (C) that are enriched in lung tumors from smokers (n = 100) versus never-smokers (n = 43). Effect size represents the difference in the proportion between the groups. A two-sample proportion z test was used to calculate the P values. Green filled circles indicate pathways with FDR-corrected Q values <0.25. Degrading pathways of smoke chemicals are indicated by blue circles in (B); plant-related metabolic pathways are indicated by red circles in (B). (o), order. (D) Taxonomy wheel plot of bacterial species that contributed to degradation of cigarette smoke metabolites (blue ring) and to the biosynthesis of plant metabolites functions (red ring) are indicated on the phylogenetic tree, along with all bacteria that are hits in lung tumors (green ring). (E) Volcano plot demonstrating enriched bacterial MetaCyc functions in ER+ versus ER− breast tumors. A two-sample proportion z test was used to calculate the P values. Colored circles indicate pathways with FDR-corrected Q values <0.25. (F) Volcano plot demonstrating the bacterial taxa enriched in melanoma patients who responded (R) to immune checkpoint inhibitors (ICI) versus nonresponders (NR). A binomial test was used to calculate the Pvalues for the enrichment or depletion of bacterial taxa in the responder cohort versus the nonresponder cohort. The size of dots reflects phylotype levels, gradually increasing from species to phylum. Colored circles indicate taxa with FDR-corrected Q values <0.25.

