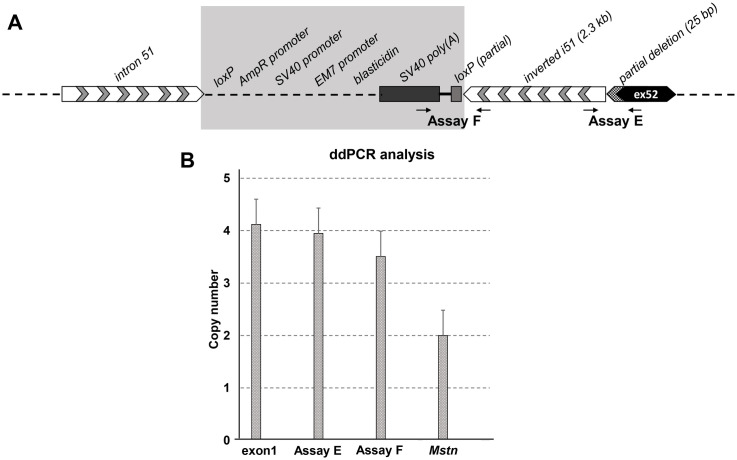
Fig 7. Genetic analysis of exon 52 deleted region.
A. Schematic representation of the exon 52 deletion region with flanking sites; the 25 bp partial deletion of exon 52 and 2.3 kb inversion of intron 51 were confirmed by sequencing. The map of the shaded area could not be confirmed by sequencing. B. ddPCR analysis of intron 51 inversion events in hDMD constructs. hDMDdel52/mdx (4 copies) samples were used in all assays. Data normalization was done relative to copy number of Mstn, which was set to 2 copies in hDMDdel52/mdx mice. Compared to the Mstn copy number, inversion specific primers in assay E showed a double signal while assay F gave lower signals in hDMDdel52/mdx mice, while they did not give any signals in hDMD/mdx mice as expected.

