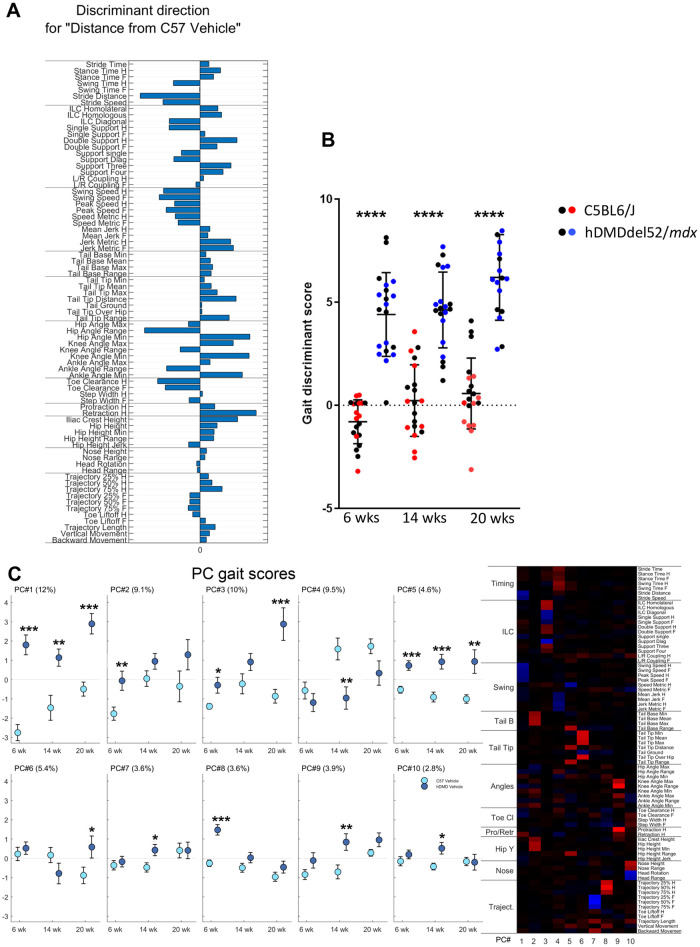
Fig 9. MotoRater analysis of hDMDdel52/mdx mice compared to C57BL6/J controls at the age of 6, 14 and 20 weeks.
A. Discriminant vector representing an overall kinematic fingerprint of the differences between hDMDdel52/mdx and C57BL6/J mice. B. Gait discriminant score reflecting the totality of gait parameters. Black dots represent male mice in each group, while blue and red dots represent females. Statistical significance was assessed per time point using an unpaired two-tailed t-test (****: P<0.0001). Statistical differences were more pronounced in female mice. C. Heatmap showing 10 PC clusters reflecting different gait features that differ between hDMDdel52/mdx and C57BL6/J mice. The right panel displays the gait scores for the different PCs. The % of the total variation of the data explained by each PC is indicated between brackets. Values are presented as mean ± standard error of mean (SEM). Significance per time point was assessed using an unpaired two-tailed t-test (*: P<0.05; **: P<0.01; ***: P<0.001). hDMDdel52-53/mdx mice were not included in MotoRater analysis.

