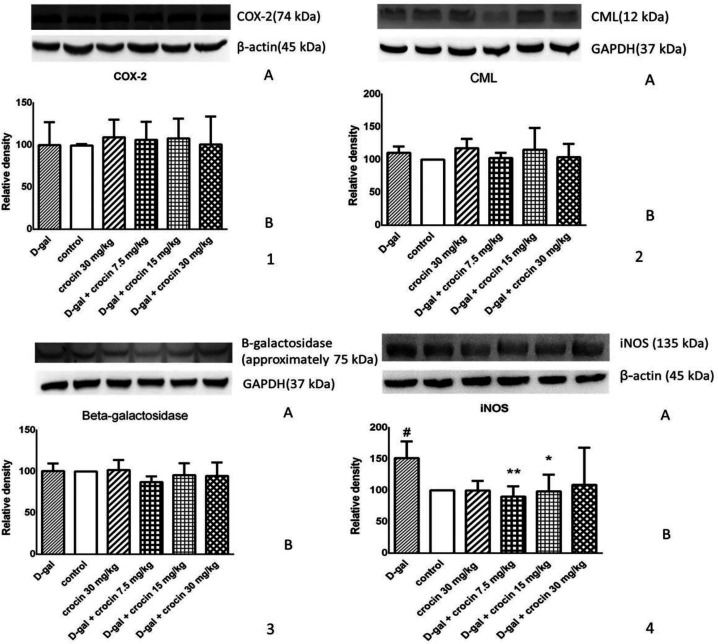
Figure 4.
Effect of crocin and D-gal on the protein levels of (1) COX-2, (2) CML, and (3) β-galactosidase. (1A), (1B) and (1C) are western blot images of COX-2, CML and β-galactosidase, respectively. (2A), (2B) and (2C) are determined using densitometric analysis. The data are presented as Mean±SD (n = 4). D-gal: D-galactose. (4) Effect of crocin and D-gal on the protein level of iNOS. (4A) is western blot images of iNOS and β-actin. (4B) is determined using densitometric analysis. The data are presented as Mean ± SD. n = 4. #P < 0.05 vs. control group; *P < 0.05, **P < 0.01 vs. D-gal-treated group

