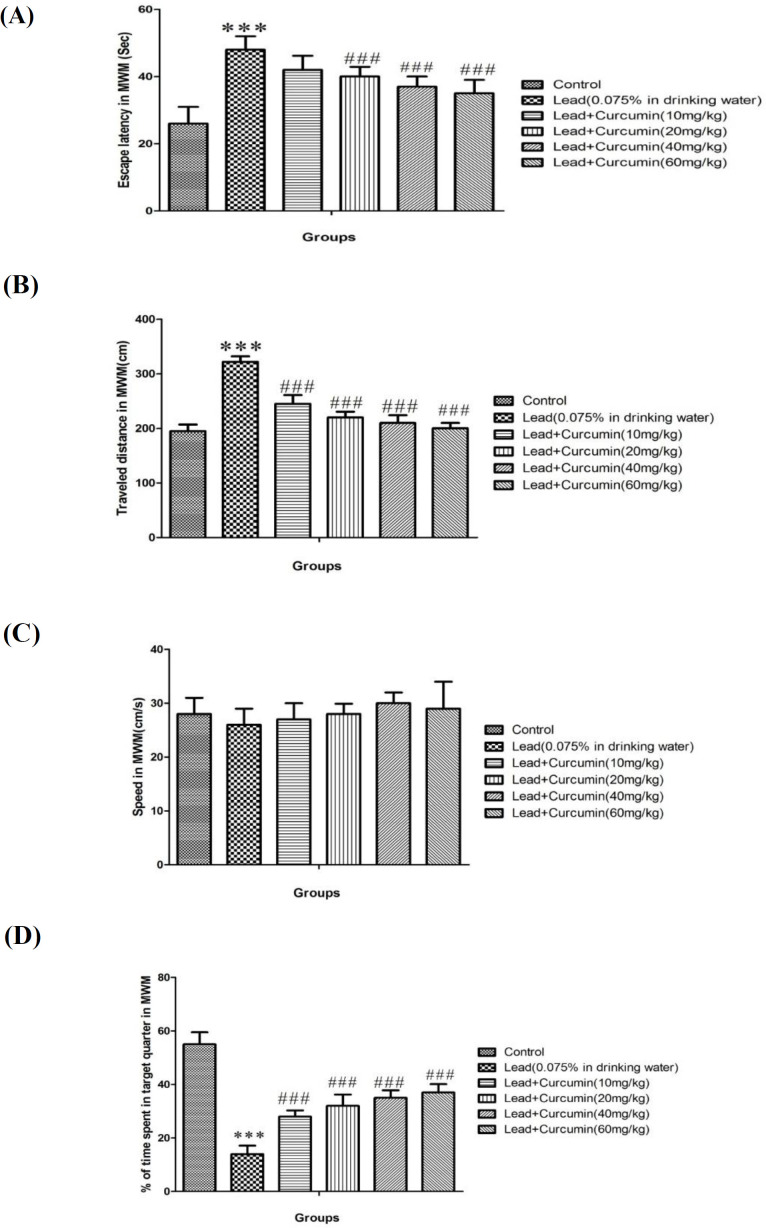
Figure 1.
Average of escape latency (A), Average of traveled distance (B), Average of swimming speed (C) Percentages of time spent in target quarter in probe trial (D) in control group and groups under treatment by drinking water containing 0.075% of lead acetate in combination with Curcumin with doses of 10, 20, 40 and 60 mg/kg across all training days using Morris Water Maze (MWM) in rats. All data are expressed as Mean ± SEM (n = 10).
*** P < 0.001 vs control.
### P < 0.001 vs group under treatment by drinking water containing 0.075% of lead acetate.

