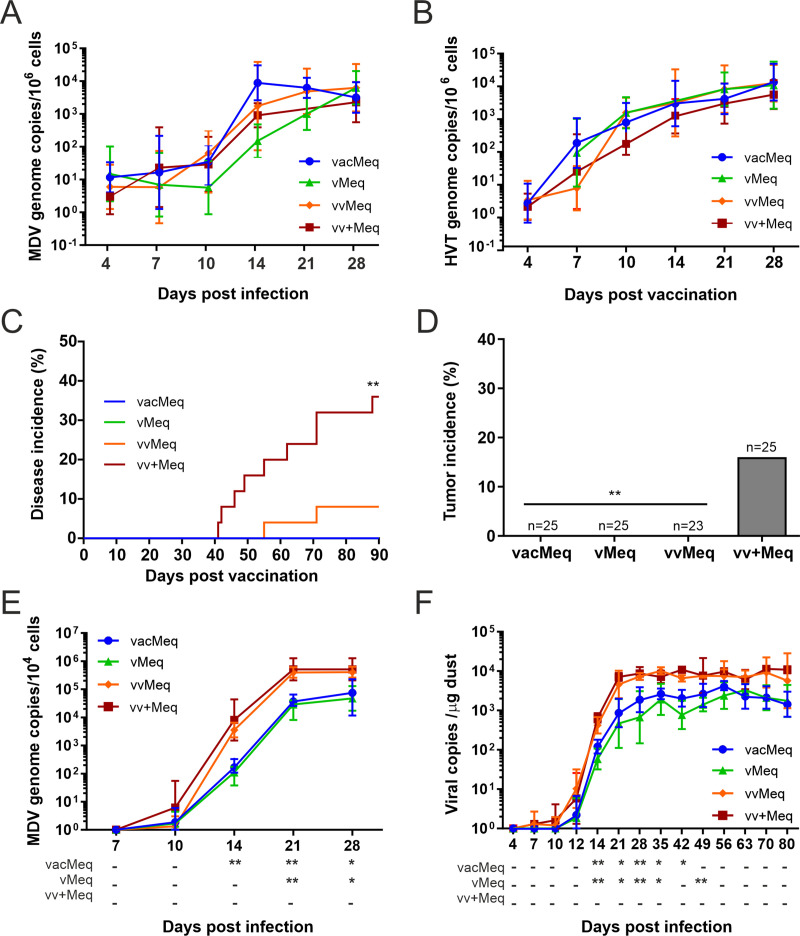
Fig 4. Pathogenesis and shedding of different meq isoform viruses in vaccinated chickens.
Viral genome copy numbers of (A) the meq isoform viruses and (B) the HVT vaccine detected in blood of vaccinated chickens infected with the meq isoform viruses (p>0.05, Kruskal-Wallis test). (C) Disease incidence and (D) tumor incidence in vaccinated chickens infected with indicated recombinant viruses. Asterisks (** p<0.0125, Fisher’s exact test) indicate statistical differences to vv+Meq in (D). (E) Viral copies from feathers of the meq recombinant viruses. (A), (B) and (E): mean MDV genome copies per one million cells are shown for the indicated time points. (F) Viral copies per μg of dust are shown for each group as validated previously [32]. Statistical differences in the feathers and dust samples are displayed as a comparison to vvMeq. Asterisks indicate significant differences (* p<0.05 and ** p<0.0125; Tukey's multiple comparisons test).

