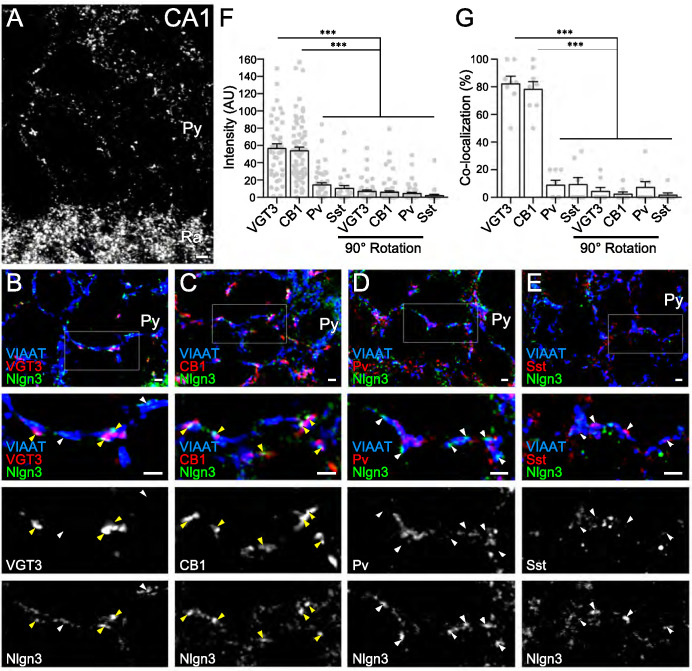
Figure 1. Nlgn3 is predominantly expressed in VGT3+ and CB1+ inhibitory synapses.
(A) Single immunofluorescence of Nlgn3 in the hippocampal CA1 region shows a basket-like clustering of Nlgn3 immunofluorescent signals around the somata of pyramidal cells. Py, st. pyramidale; Ra, st. radiatum. (B–E) Triple immunofluorescence for Nlgn3, VIAAT, and interneuron markers: VGT3 (B), CB1 (C), Pv (D), and Sst (E). The boxed area in low magnification images is enlarged in lower panels. Arrowheads indicate Nlgn3 immunofluorescent puncta associated with (yellow) or distant from (white) interneuron markers. (F and G) Summary of the relative intensity (F) and co-localization frequency (G) of Nlgn3 immunofluorescent signals at different inhibitory synapses. Plots are obtained from each synapse for intensities (F) or image for co-localizations (G). Noise levels for the intensity and co-localization were obtained from images with the Nlgn3 channel rotated 90° (90° rotation). ***p<0.001; n.s. not significant; One-way ANOVA with Sidak’s post hoc test. Bars on each column represent mean ± SEM. Scale bars, 100 μm (A) and 2 μm (B–E).


