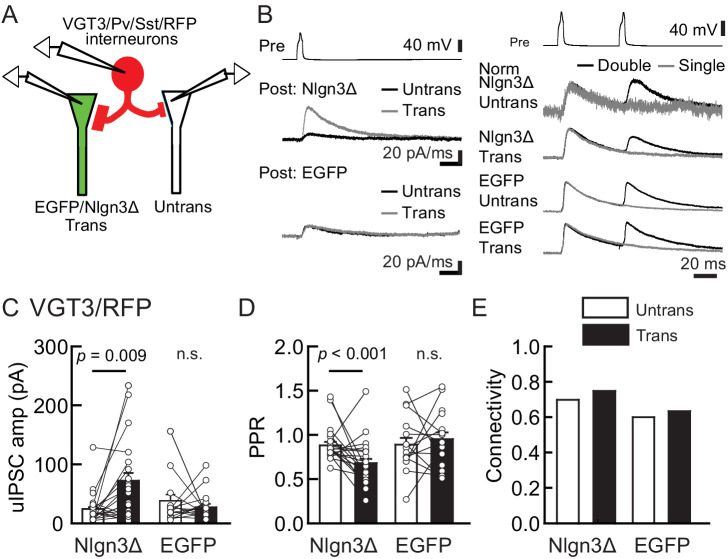
Figure 2. Nlgn3Δ overexpression (OE) specifically potentiates VGT3+ interneuron-mediated unitary synaptic transmission.
The effects of OE of Nlgn3Δ isoform or enhanced green fluorescent protein (EGFP, control) in hippocampal CA1 pyramidal neurons on inhibitory inputs mediated by VGT3+ inhibitory interneurons. (A) Configuration of the triple whole-cell recording for VGT3+, Pv+, and Sst+ interneurons forming synapses with pyramidal neurons. (B) Sample traces of unitary inhibitory postsynaptic currents (uIPSCs). Left top, averaged sample traces of a single presynaptic action potential (AP) evoked in a VGT3+ interneuron. Left middle and bottom, superimposed averaged sample uIPSC traces (Untrans: black; trans: dark gray) induced by an AP. Right, superimposed averaged sample traces of uIPSCs evoked by single (dark gray) and double (black) APs in VGT3+ interneurons. uIPSCs are normalized to the first amplitude. Because the first uIPSC overlaps with the second uIPSC, to accurately measure the amplitude of the second IPSC, we ‘cancelled’ the first uIPSC by subtracting the traces receiving a single pulse (gray) from those receiving a paired pulse (black), both normalized to the first response. The amplitude (C) and paired-pulse ratio (PPR) (D) of uIPSCs were plotted for each pair of transfected (Trans) and neighboring untransfected (Untrans) cells (open symbols). Bar graphs indicate mean ± SEM. (E) Synaptic connectivity between presynaptic inhibitory interneuron and postsynaptic untransfected (open bars) or transfected (black) pyramidal neurons. Numbers of cell pairs: Nlgn3Δ or EGFP at VGT3+ synapses (42 pairs/23 mice and 30/21). The number of tested slice cultures is the same as that of cell pairs. n.s., not significant. Mann–Whitney U-test.


