. 2020 Dec 23;9:e59545. doi: 10.7554/eLife.59545

Figure 4. Endogenous Nlgn3 specifically regulates VGT3+, but not Pv+ and Sst+, interneuron-mediated unitary synaptic transmission.

The effects of shNlgn3 or shCntl expression in hippocampal CA1 pyramidal neurons were compared between three different inhibitory inputs mediated by VGT3+ (A–D), Pv+ (E–H), and Sst+ (I–L) inhibitory interneurons. (A, E, and I) Sample traces of unitary inhibitory postsynaptic currents (uIPSCs). Left, superimposed averaged sample traces of uIPSC (Untrans: black; trans: dark gray) induced by an action potential (AP). Middle and right, superimposed averaged sample traces of uIPSCs evoked by single (dark gray) and double (black) APs in VGT3+ (A), Pv+ (E), and Sst+ (I) interneurons. uIPSCs are normalized to the first amplitude. The amplitude (B, F, and J) and paired-pulse ratio (PPR) (C, G, and K) of uIPSCs were plotted for each pair of transfected (Trans) and neighboring untransfected (Untrans) cells (open symbols). Bar graphs indicate mean ± SEM. (D, H, and L) Synaptic connectivity between presynaptic inhibitory interneuron and postsynaptic untransfected (open bars) or transfected (black) pyramidal neurons. Numbers of cell pairs: shNlgn3 or shCntl at VGT3+ synapses (28 pairs/15 mice and 37/17), at Pv+ synapse (12/4 and 16/5), and Sst+ synapses (26/11 and 21/10). The number of tested slice cultures is the same as that of cell pairs. n.s., not significant. Mann–Whitney U-test.

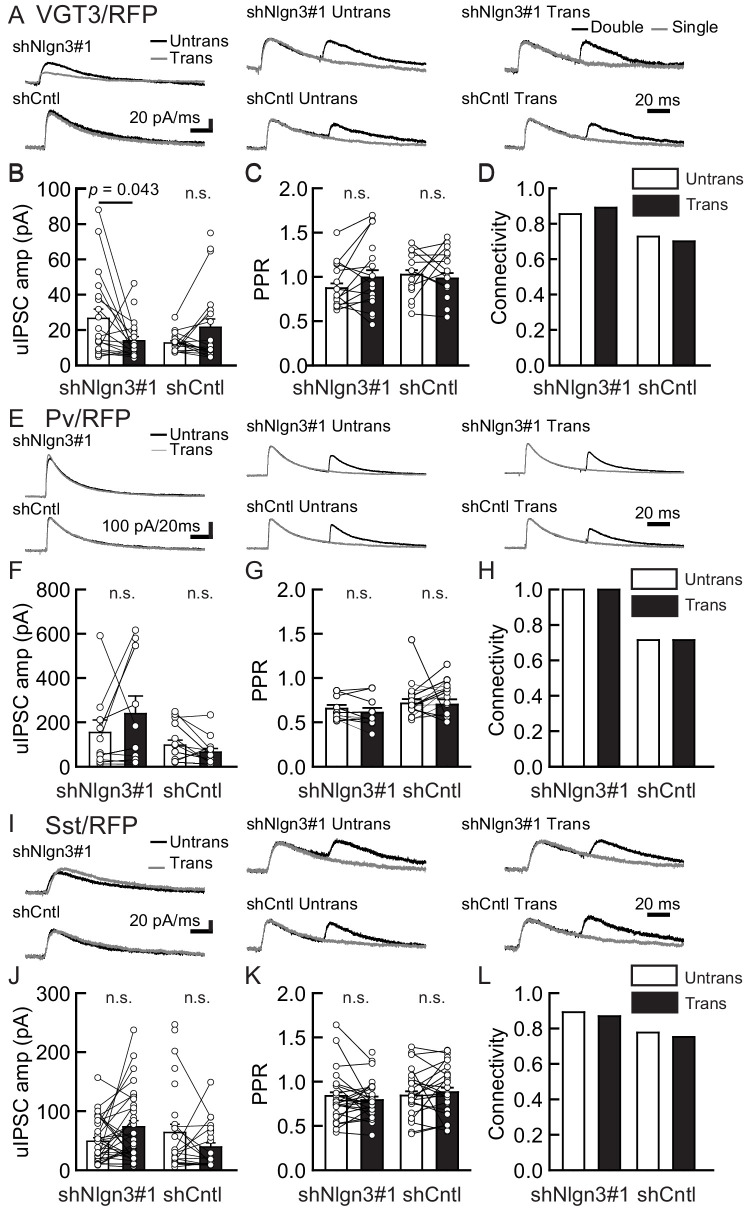
Figure 4.

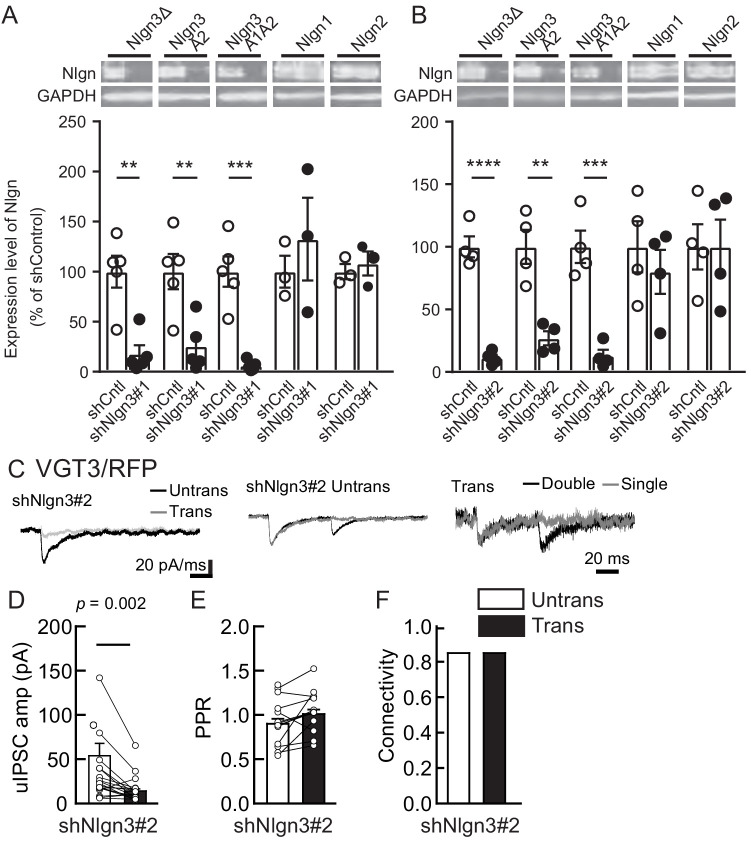
Figure 4—figure supplement 1. Nlgn3 shRNAs specifically knockdown Nlgn3 protein and regulate VGT3+ inhibitory synaptic transmission.

Figure 4—figure supplement 1.

(A, B) Specificity of Nlgn3 shRNA constructs, shNlgn3#1 (A) and shNlgn3#2 (B), confirmed in HEK293T cell lysates overexpressing HA-tagged Nlgn3Δ, Nlgn3A2, Nlgn3A1A2, Nlgn1, and Nlgn2. (Top) Immunoblot images with HA and GAPDH. Membranes were first probed with rabbit HA antibody, stripped, and then re-probed with mouse GAPDH antibody. (Bottom) Summary bar graphs with individual scattered plots of shRNA effects. (C–F) Effects of shNlgn3#2 expression in hippocampal CA1 pyramidal neurons were compared between three different inhibitory inputs mediated by VGT3+ inhibitory interneurons. (C) Sample traces of uIPSCs measured at −70 mV. Left, superimposed averaged sample traces of uIPSC (Untrans: black; trans: dark gray) induced by an action potential (AP). Middle and right, superimposed averaged sample traces of uIPSCs evoked by single (dark gray) and double (black) APs in VGT3+ interneurons. uIPSCs are normalized to the first amplitude. The amplitude (D) and paired-pulse ratio (PPR) (E) of uIPSCs were plotted for each pair of transfected (Trans) and neighboring untransfected (Untrans) cells (open symbols). Bar graphs indicate mean ± SEM. (F) Synaptic connectivity between presynaptic inhibitory interneuron and postsynaptic untransfected (open bars) or transfected (black) pyramidal neurons. Numbers of cell pairs: shNlgn3 at VGT3+ synapses (18 cell pairs/10 mice). The number of tested slice cultures is the same as that of cell pairs. n.s., not significant. Mann–Whitney U-test.